What is Customer Lifetime Value (CLV/LTV)? Formula, Calculation, and Importance
Quick Answer
Customer Lifetime Value (CLV or LTV) is the total revenue a business can expect from a single customer over the entire course of their relationship. It is typically calculated as Average Order Value × Purchase Frequency × Customer Lifespan. CLV helps businesses determine how much they can afford to spend to acquire a customer and which customer segments deserve the most retention investment.
Customer Lifetime Value (CLV) is one of the most important metrics in business — it determines how much a customer is actually worth, not just at the moment of first purchase.
Understanding CLV transforms how businesses think about customer acquisition cost, retention investment, and segment prioritisation.
What is Customer Lifetime Value?
Customer Lifetime Value (also called CLV, CLTV, or LTV) is the total net revenue a business can expect to earn from a single customer account over the entire duration of their relationship.
It answers the question: "If I acquire this customer today, how much revenue will they generate for me over all the years they remain a customer?"
CLV turns a single transaction into a long-term asset valuation — enabling smarter decisions about how much to invest in acquiring, serving, and retaining each customer type.
How to Calculate Customer Lifetime Value
Basic CLV Formula
CLV = Average Order Value × Purchase Frequency per Year × Average Customer Lifespan (Years)
Example:
- Average order value: ₹5,000
- Purchase frequency: 4 orders per year
- Average customer lifespan: 3 years
- CLV = ₹5,000 × 4 × 3 = ₹60,000
Margin-Adjusted CLV
For a more accurate picture, multiply by gross margin:
CLV = (Average Order Value × Purchase Frequency × Average Lifespan) × Gross Margin %
Example:
- ₹60,000 × 40% gross margin = ₹24,000 CLV (margin-adjusted)
This is the actual profit contribution from the customer relationship — the right number to compare against CAC.
Predictive CLV (Advanced)
Statistical models use cohort analysis and machine learning to predict CLV for new customers based on early behavioural signals — enabling personalised engagement before the full LTV is realised.
LTV:CAC Ratio — The Growth Health Metric
The LTV:CAC ratio compares what a customer is worth to what it cost to acquire them:
LTV:CAC = Customer Lifetime Value / Customer Acquisition Cost
- < 1:1 — You're losing money on every customer
- 1:1 to 3:1 — Marginal; may not be sustainable
- 3:1 or higher — Healthy growth economics
- > 5:1 — You may be under-investing in acquisition (growth opportunity)
Investors in Indian SaaS and D2C companies frequently use LTV:CAC as a primary health metric.
What CLV Tells You That Other Metrics Don't
Which customers are most valuable: A customer who purchases twice with high value may have lower CLV than one who purchases monthly with moderate value. CLV-based segmentation ensures retention resources go to the highest-value customers.
How much you can spend to acquire a customer: If your CLV is ₹60,000 with 40% margin, you can afford to spend up to ₹8,000 in CAC while maintaining a 3:1 LTV:CAC ratio. Without CLV, CAC targets are arbitrary.
Which acquisition channels produce the most valuable customers: Customers from different channels may have similar first-order value but dramatically different LTV. A referral customer may be worth 2x a paid search customer over their lifetime.
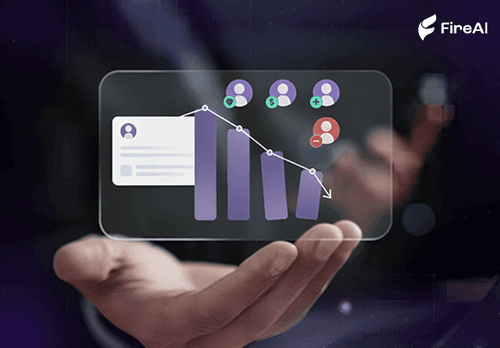
Whether retention investments are paying off: If CLV is increasing over time, your retention and product investments are working. If CLV is declining, churn is too high or order frequency is dropping.
CLV for Indian Businesses
B2B Distribution
For Indian distributors and manufacturers with long-term trade relationships, CLV is particularly relevant:
- Annual order value × years of relationship
- Factor in volume growth as the customer scales
- Adjust for payment behaviour (DSO affects effective CLV)
D2C and E-Commerce
Critical for any D2C brand competing in India's increasingly expensive digital acquisition environment:
- Understand repeat purchase rate and frequency by acquisition channel
- Use CLV to set Google/Meta advertising bid caps
- Prioritise high-LTV segments for loyalty and retention programmes
SaaS and Subscription Businesses
Monthly/annual recurring revenue × retention rate is the most direct CLV calculation for subscription businesses.
How to Improve Customer Lifetime Value
Increase average order value: Upselling, cross-selling, bundle offers
Increase purchase frequency: Email/WhatsApp re-engagement, subscription models, reminder programs
Extend customer lifespan: Improve product quality, customer service, loyalty programs, and proactive churn detection
Improve margin: Reduce COGS, optimise fulfilment costs, reduce discounting
For analytics-driven CLV improvement, see cohort analysis for tracking CLV trends by acquisition period.
Explore FireAI Workflows
Jump from the concept on this page into the product features and solution paths most relevant to it.
Industry Analytics In India
Comparison pages and implementation guidance for industry-specific BI, dashboards, and analytics use cases in India.
Ready to Transform Your Business Data?
Experience the power of AI-powered business intelligence. Ask questions, get insights, make better decisions.
Frequently Asked Questions
CLV (Customer Lifetime Value) and LTV (Lifetime Value) are the same metric — both refer to the total expected revenue or profit from a customer over their entire relationship with the business. Some use CLV for "customer lifetime value" and LTV for "lifetime value" interchangeably. CLTV is also used.
The basic formula is: CLV = Average Order Value × Purchase Frequency per Year × Average Customer Lifespan in Years. A more accurate version multiplies by gross margin percentage to get the profit-adjusted CLV. Advanced predictive CLV uses statistical models based on early customer behaviour.
A ratio of 3:1 or higher is generally considered healthy — meaning each customer generates 3x what it cost to acquire them. Ratios below 1:1 mean you lose money on every customer. For Indian D2C and SaaS companies targeting growth, 3:1 is often the minimum threshold investors and founders target.
CLV determines how much you can afford to spend to acquire a customer. Without knowing CLV, marketing teams set arbitrary CAC caps. With CLV, you can calculate the maximum allowable CAC that maintains a healthy LTV:CAC ratio — enabling more aggressive acquisition spending where justified and reining in inefficient spend.
Related Questions In This Topic
What is Cohort Analysis? Definition, Examples, and Business Applications
Cohort analysis groups customers or users by a shared characteristic (like acquisition date) to track behaviour over time. Learn how cohort analysis reveals retention, LTV, and churn patterns that aggregate metrics hide.
What is a Marketing Analytics Dashboard? Metrics, Examples, and Best Practices
A marketing analytics dashboard consolidates campaign performance, channel attribution, lead generation, and CAC metrics in one view. Learn what to include in a marketing dashboard and how to measure marketing ROI effectively.
E-commerce Analytics in India: Marketplace Performance, CAC, and LTV
E-commerce analytics in India covers marketplace seller performance, customer acquisition cost, LTV, and unit economics. Learn key metrics for Indian e-commerce businesses.
Food and Beverage Analytics in India: Outlet Performance and Supply Chain
Food and beverage analytics in India covers outlet performance, menu engineering, supply chain management, and delivery analytics. Learn key dashboards for Indian F&B businesses.
Related Guides From Our Blog
Data-Driven Customer Success: How Real-Time Metrics Reduce Churn
Discover how data-driven customer success teams use real-time metrics, causal analytics, and tools like FireAI to predict churn before it happens and turn insights into retention.

The 10 KPIs Every CEO Should Track Weekly and How Fire AI Automates them
CEOs don’t fail because they lack data. They fail because the right insights arrive too late. In today’s high-speed markets, leadership can’t afford to wait weeks for quarterly reports or rely on siloed dashboards. Weekly visibility into the most critical Key Performance Indicators (KPIs) can mean the difference between scaling ahead—or reacting too late. This blog reveals the 10 KPIs every CEO should track weekly and explains how AI-powered platforms like Fire AI automate them with predictive analytics, real-time dashboards, and conversational insights.

How a Modern Analytics Platform Transforms Business Intelligence
Why faster decision-making, real-time analytics, and AI-driven intelligence separate market leaders from laggards—and how Fire AI closes the gap between data and action.