Quick answer
Demand forecasting predicts future product demand using historical sales data, statistical methods, and machine learning. The three main approaches are time series analysis (pattern-based), causal modelling (driver-based), and ML forecasting (pattern + driver combined). Platforms like FireAI automate demand forecasting directly from Tally or DMS data without requiring a data science team.
Demand forecasting is the process of estimating future customer demand for a product or service over a defined time horizon using historical data, statistical models, and market signals. Accurate demand forecasts drive better inventory decisions, reduce stockouts and overstock, and improve cash flow — making them one of the highest-ROI analytics investments for any product-led business.
For Indian businesses in FMCG, D2C, distribution, and retail, demand forecasting often runs on spreadsheets or gut instinct. The result is excess dead stock, missed sales, and working capital tied up in the wrong SKUs. Predictive analytics tools now make automated demand forecasting accessible without building a dedicated data science team.
What is Demand Forecasting?
Demand forecasting answers one core business question: how much of each product should we stock, produce, or procure over the coming days, weeks, or months?
It draws on past sales patterns, seasonal cycles, promotional history, and external signals to generate a forward-looking demand estimate. The accuracy of these estimates directly impacts:
- Inventory levels — order too little and you lose sales; order too much and you tie up cash
- Procurement and production planning — lead times require advance demand signals
- Pricing and promotions — knowing when demand will spike helps plan offers profitably
- Cash flow — stock is capital; better forecasts free up working capital
For supply chain teams, visit FMCG supply chain use cases for real-world examples of how demand forecasting reduces cost and improves fill rates.
The Three Core Demand Forecasting Methods
1. Time Series Forecasting
Time series methods predict future demand by identifying patterns in historical demand data over time. They assume that past patterns will continue into the future.
Key techniques:
- Moving averages — smooth out short-term fluctuations to reveal the underlying trend
- Exponential smoothing (ETS) — assigns more weight to recent observations, useful when demand trends are shifting
- ARIMA (AutoRegressive Integrated Moving Average) — captures trend, seasonality, and autocorrelation in a single model
- Prophet — Facebook's open-source model built for business time series with strong seasonality and holiday effects
Best for: SKUs with stable, repeatable seasonality — FMCG staples, retail apparel by season, or B2B consumables with predictable reorder cycles.
Limitation: Time series models are blind to external drivers. They cannot explain why demand is changing — only that it has changed in the past.
2. Causal (Econometric) Forecasting
Causal models forecast demand by modelling the relationship between demand and the factors that drive it — price, promotions, competitor activity, weather, GDP, or marketing spend.
Key techniques:
- Multiple linear regression — quantifies how much each driver (price, promo, season) independently affects demand
- Distributed lag models — captures delayed effects, e.g., a promotion running this week affects demand over the next 3 weeks
- Elasticity modelling — measures how sensitive demand is to price changes (critical for FMCG and D2C pricing strategy)
Best for: Products with high promotional sensitivity, new product categories without long history, or businesses actively running marketing campaigns and wanting to measure their demand lift.
Limitation: Requires clean, structured data on the causal variables — not just sales history.
3. Machine Learning (ML) Demand Forecasting
ML models treat demand forecasting as a supervised learning problem. They learn complex, non-linear relationships between hundreds of features (past sales, price, promo flags, calendar effects, weather, regional signals) and future demand.
Key techniques:
- Gradient boosting (XGBoost, LightGBM) — the most widely used ML approach for tabular demand data; handles mixed features and captures non-linear interactions
- Random forests — good baseline with strong out-of-box accuracy and natural feature importance output
- LSTM neural networks — deep learning for long-sequence patterns; useful when demand has long memory effects or complex temporal dynamics
- Hybrid models — combine time series decomposition with ML to separate trend/seasonality from driver-based effects
Best for: Businesses with large SKU catalogues, multiple demand drivers (price + promo + weather + location), or complex cross-category effects.
Limitation: Requires more data volume and engineering work. Overfitting risk increases with small datasets or infrequent SKUs.
Time Series vs Causal vs ML — Which Method to Use?
| Factor | Time Series | Causal | Machine Learning |
|---|---|---|---|
| Data required | Sales history only | Sales + driver variables | Sales + drivers + volume |
| Handles seasonality | Strong | Moderate | Strong |
| Handles promotions | Weak | Strong | Strong |
| Handles new products | Weak | Moderate | Moderate |
| Explainability | High | High | Moderate |
| Accuracy at scale | Moderate | Moderate | High |
| Setup complexity | Low | Medium | High |
Most production demand forecasting systems use ensemble approaches — combining time series decomposition with ML models — to get the accuracy of ML with the interpretability of time series components.
How AI Demand Forecasting Works
Traditional demand forecasting required data engineers, Python notebooks, and weeks of modelling work before a business user saw a single forecast. AI demand forecasting changes this by:
- Auto-ingesting historical data from ERP, Tally, DMS, or e-commerce platforms
- Feature engineering automatically — creating lag features, rolling averages, calendar flags, and promo indicators from raw transaction data
- Selecting and training models without manual configuration, using AutoML approaches
- Generating SKU-level or category-level forecasts with confidence intervals so planners know forecast uncertainty
- Retraining continuously as new sales data arrives, so the model adapts to demand shifts
The output is a business-ready demand plan that procurement, sales, and finance teams can act on — not a Jupyter notebook.
Demand Forecasting in Practice: Indian Business Examples
FMCG distributor (Mumbai): A regional distributor handling 400 SKUs across 3 states connected Tally sales data to FireAI. Automated time series models identified seasonal demand peaks by SKU and flagged 60 slow-moving lines ahead of quarter-end — reducing dead stock write-offs by ₹18 lakh in the first season.
D2C apparel brand (Bengaluru): An online fashion brand used ML-based demand forecasting to plan production 8 weeks ahead. By incorporating past sell-through rates and promotional calendar data, they cut overproduction by 22% while improving in-stock rate for bestsellers from 74% to 91%.
Pharma distributor (Hyderabad): A distributor managing 800+ medicines used causal forecasting to model seasonal illness patterns by region. This reduced expiry waste from ₹9 lakh/month to ₹2.5 lakh/month by aligning procurement with predicted regional demand.
Auto parts trader (Pune): A B2B trader connected their DMS and Tally data to get weekly demand forecasts by part number. Reorder alerts fired automatically when forecast demand exceeded current stock — cutting emergency procurement costs by ₹6 lakh per quarter.
Demand Forecasting Inputs and Data Sources
Reliable demand forecasts require clean, structured input data:
Primary inputs:
- Historical sales by SKU, region, and channel (minimum 12 months; 24+ months preferred)
- Stock movements and goods receipt notes
- Return and cancellation records (demand signal adjustment)
Enrichment inputs (improves accuracy significantly):
- Promotional calendar — which products were discounted when and by how much
- Price history by SKU
- Holidays and regional festivals (Diwali, harvest season, Ramzan)
- New product launch dates
External signals (advanced):
- Weather data for weather-sensitive categories
- Market index or GDP data for macro-sensitive sectors
- Competitor pricing signals (where available)
Common Demand Forecasting Mistakes
1. Forecasting at the wrong level of granularity — Aggregated category forecasts miss SKU-level imbalances. A garment retailer may forecast category demand accurately but still overstock size XL while undersupplying size S.
2. Ignoring promotions in the history — Training on raw sales without flagging promotional periods makes the model learn inflated "normal" demand. Causal modelling or promo-flag features are essential.
3. Using too little history — Models trained on 3 months of data cannot capture seasonal cycles. At least 2 annual cycles of data are needed for reliable seasonal forecasting.
4. No confidence intervals — A point forecast (e.g., "demand will be 500 units") without uncertainty range gives a false sense of precision. Planners need to see the likely range to make risk-aware stocking decisions.
5. Set-and-forget models — Demand patterns shift as markets change. Models not retrained on fresh data degrade quickly after product launches, price changes, or competitive entries.
How FireAI Automates Demand Forecasting from Tally and DMS
FireAI connects directly to Tally ERP and DMS data to generate automated demand forecasts without requiring a data team:
Data connection: FireAI pulls historical sales, purchase, and inventory data directly from Tally through a secure connector — no data migration or manual exports needed.
Auto-forecasting: The system builds SKU-level demand models using time series and ML approaches, automatically handling seasonality, data gaps, and sparse SKUs.
Natural language demand queries: Ask "What will be my top 10 highest-demand SKUs next month in Maharashtra?" and FireAI returns a ranked forecast with confidence intervals — in plain English or Hindi.
Inventory alerts: When forecasted demand is on track to exceed current stock before the next procurement cycle, FireAI surfaces a reorder alert with suggested quantities.
Dashboard integration: Demand forecasts appear as a live dashboard tile updated weekly — visible to procurement, sales, and finance teams without any manual refresh.
For FMCG and distribution businesses, see FMCG supply chain analytics use cases to understand how demand forecasting fits into a broader supply chain intelligence workflow.
Ready to act on your data?
See how teams use FireAI to ask in plain language and get analytics they can trust.
Explore FireAI workflows
Go from this topic into product features and solution paths that match what you read here.
Topic hub
AI Analytics
Guides on natural language querying, AI-powered analytics, forecasting, anomaly detection, and automated insights.
Explore hubFrequently asked questions
Related in this topic
What is Predictive Analytics? Methods and Examples
Predictive analytics uses statistical algorithms and machine learning to forecast future outcomes based on historical data. Learn how predictive modeling works, which methods are used, and how businesses apply it for sales forecasting, risk management, and strategic planning.
What is a Supply Chain Dashboard? Key Metrics
A supply chain dashboard is a visual analytics tool that tracks procurement, inventory, logistics, and supplier performance metrics in one place. Learn what a supply chain dashboard includes, which KPIs matter most, and how to build one for your business.
What is an Inventory Dashboard? Metrics and Features
An inventory dashboard provides real-time visibility into stock levels, turnover, reorder alerts, and dead stock. Learn what metrics belong in an inventory dashboard and how Indian businesses can build one from Tally or their ERP.
FMCG Analytics in India: Sales & Distribution
FMCG analytics in India covers secondary sales tracking, distributor performance, beat coverage, and retailer segmentation. Learn key metrics for Indian FMCG companies.
From the blog

Measuring Promotion Effectiveness: A Data-Driven Guide for FMCG Marketers
FMCG brands in India spend 15–25% of gross revenue on trade promotions and A&SP (advertising and sales promotion) every year. Most can tell you how much they spent. Very few can tell you what it returned. The problem isn't a lack of data — it's that the data lives in disconnected places. Trade spend sits in finance. Off-take data lives with the distributor or field team. A&SP budgets are tracked in a marketing spreadsheet. No single view ties promotional investment to consumer pull at the outlet level. The result is a budget cycle where last year's spend allocation becomes next year's default, because no one has the numbers to argue for something different. This guide walks through how FMCG marketing and trade teams can build a promotion effectiveness framework that actually connects spend to outcome — not just channel-level assumptions.
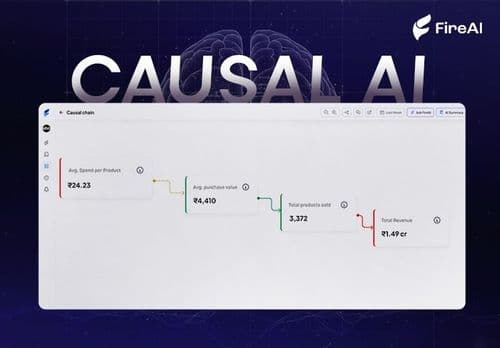
Causal AI Explained: Uncovering the “Why” in Data with Machine Learning
Causal AI reveals not just what will happen, but why — and exactly what changes if you act differently. It turns predictions into high-ROI decisions by uncovering true cause-and-effect in your data.
Days Sales Outstanding (DSO): The Indian B2B Operator's Ultimate Guide
Days Sales Outstanding (DSO) explained for Indian B2B and FMCG teams: the formula, 2026 benchmarks, and what AI analytics surfaces beyond a single number.