Quick answer
FMCG analytics in India tracks secondary sales, distributor ROI, beat plan compliance, and scheme effectiveness across a multi-tier distribution network reaching 9+ million outlets. In a $110 billion market, tools like FireAI connect Tally and DMS data to give brand teams real-time visibility into territory performance — with NLQ in Hindi/English, starting at ₹4,999/month.
India's FMCG sector is one of the most distribution-intensive markets in the world, with products flowing through C&F agents, super-stockists, distributors, sub-distributors, and finally to millions of retail outlets. Analytics at every stage of this chain is what separates high-performing FMCG companies from those that lose market share to more data-savvy competitors.
Why FMCG Analytics Is Critical in India
India's FMCG distribution challenges are unique:
- Multi-tier distribution: Products pass through 3–5 intermediaries before reaching the consumer, creating data visibility gaps
- 9+ million retail outlets: General trade (kirana stores) still accounts for ~80% of FMCG sales in India
- Regional brand strength: Local and regional FMCG brands compete effectively in specific geographies, requiring granular market intelligence
- Scheme-heavy selling: Trade schemes, retailer margins, and channel-specific pricing create complex profitability calculations
- Field force scale: Large FMCG companies deploy thousands of salesmen whose productivity directly impacts market coverage
Core FMCG Metrics Indian Companies Track
Secondary Sales Metrics
Secondary sales (distributor-to-retailer) are the true demand signal in Indian FMCG:
- Secondary sales value and volume: By SKU, brand, geography, and channel
- Primary-to-secondary ratio: Indicates channel stuffing when primary consistently exceeds secondary
- Growth rate: Month-on-month, year-on-year, and vs category growth
- Per capita consumption: By district or state — identifies under-penetrated markets
Distribution Metrics
- Numeric distribution: Number of outlets where product is available
- Weighted distribution: Distribution weighted by outlet sales potential
- ECO (Effective Coverage of Outlets): Outlets billed at least once in a period
- Outlet universe vs coverage: How much of the addressable market is actually reached
- New outlet additions per month: Expansion metric for field teams
Beat and Field Force Metrics
- Beat compliance: Did the salesman visit all planned outlets on the designated day?
- Productive calls: Percentage of visits that resulted in an order
- Lines per call (LPC): Average number of SKUs ordered per visit — indicates depth of selling
- Average order value: Tracks whether salesmen are pushing for larger orders
- Time in market: Hours spent in the field vs administrative time
Distributor Performance
- Distributor ROI: Net margin earned by the distributor after all costs
- Claim settlement time: How quickly the company settles distributor claims for schemes, damages, and returns
- Stock days at distributor: Inventory held by the distributor — target is typically 15–21 days
- Fill rate: Percentage of retailer orders fulfilled from distributor stock
- Outstanding and overdue receivables: Credit health of the distribution network
Scheme and Promotion Analytics
- Scheme ROI: Incremental sales generated vs scheme cost
- Scheme redemption rate: Percentage of eligible retailers who claimed the scheme
- Cannibalisation analysis: Did the scheme steal sales from other SKUs rather than growing the category?
- Trade margin analysis: Effective margin at each level of the distribution chain
FMCG Analytics Dashboards
National Sales Head Dashboard
- All-India secondary sales: MTD vs target, vs same month last year
- Region-wise performance heat map
- Top and bottom 10 distributors by growth
- Channel mix: GT vs MT vs e-commerce contribution
- New product launch tracking
Regional Manager Dashboard
- State/zone-wise secondary sales
- Town-class-wise performance (metro, Tier 1, Tier 2, rural)
- Beat compliance and productive calls summary
- Distributor stock and billing status
- Competitive activity alerts from field reports
Brand Manager Dashboard
- Brand-wise market share trend (if syndicated data available)
- SKU-wise secondary sales and growth
- Price realisation analysis (effective selling price after schemes)
- Modern trade vs general trade performance
- E-commerce channel tracking (marketplace share, pricing compliance)
Data Sources for FMCG Analytics in India
- DMS (Distributor Management System): Botree (formerly Botree Software), Bizom, FieldAssist, Salesforce — these are the primary sources of secondary sales data
- SFA (Sales Force Automation): Beat plans, outlet visits, order capture — often the same platform as DMS
- ERP: SAP, Oracle, Tally — for primary sales and financial data
- Syndicated data: Nielsen, Kantar — for market share and category data (available to larger companies)
- Modern trade data: Direct feeds from Reliance Retail, DMart, Spencer's, Star Bazaar portals
- E-commerce: Amazon, Flipkart, BigBasket seller dashboards
The Visibility Gap
The biggest analytics challenge in Indian FMCG is the gap between primary sales (company-to-distributor, well tracked in ERP) and secondary sales (distributor-to-retailer, tracked in DMS with varying data quality). Companies that bridge this gap with reliable DMS data and analytics have a significant competitive advantage.
Common Challenges
Data Quality from Distributors
Not all distributors use DMS consistently. Smaller distributors may bill manually, creating gaps in secondary sales data. Progressive FMCG companies incentivise DMS adoption and penalise non-compliance.
Rural Market Analytics
Rural India accounts for ~36% of FMCG consumption but has the weakest data infrastructure. Companies like HUL and ITC have invested in direct rural distribution models (Project Shakti, e-Choupal) that generate better data than traditional sub-distributor networks.
Integrating Modern Trade and E-commerce Data
Modern trade (organised retail) and e-commerce data exist in separate systems. Unified analytics requires pulling data from MT portals, marketplace seller panels, and DMS into a single BI platform.
How FireAI Helps Indian FMCG Businesses
FireAI bridges the data gaps that plague Indian FMCG distribution:
- Tally + DMS integration: Connect Tally (primary sales, financials) with Botree, Bizom, or FieldAssist (secondary sales, beat data) to get a unified sales view — no manual reconciliation
- 250+ connectors: Pull data from Amazon Seller Central, Flipkart, BigBasket, modern trade portals, and CRM systems alongside DMS and Tally
- Ask in Hindi or English: A regional sales manager can type "Gujarat में पिछले महीने किस distributor की secondary sales सबसे कम रही?" and get instant answers — no SQL, no data team
- ₹4,999/month flat pricing: A mid-size FMCG company with 30 distributors and 5 regional managers pays one flat price. No per-user fees that scale with your sales team size
- Pre-built FMCG dashboards: Secondary sales tracker, beat compliance report, scheme ROI analysis, distributor scorecard, and channel mix dashboard — live in days
- Zero-code alerts: Set up automatic alerts when beat adherence drops below 70%, when any distributor's stock exceeds 25 days, or when secondary-to-primary ratio falls below 0.8
Real Indian FMCG Scenario
A ₹200 crore regional FMCG brand in Maharashtra with 150 distributors struggled with secondary sales visibility. Manual DMS reports took 5 days to compile. After connecting Tally + Bizom to FireAI, the national sales head got daily automated dashboards. Result: beat adherence improved from 58% to 82%, and secondary sales grew 18% in two quarters — without adding salesmen.
FMCG KPIs You Can Track from Day One
| KPI | Source | Indian Benchmark |
|---|---|---|
| Secondary sales growth | DMS | 10–15% YoY for growing brands |
| Beat adherence | SFA/DMS | Target: 80–90%, avg: 50–60% |
| Productive calls % | SFA/DMS | 60–75% target |
| Lines per call | DMS | 4–8 for general trade |
| Distributor stock days | Tally/DMS | 15–21 days optimal |
Ready to act on your data?
See how teams use FireAI to ask in plain language and get analytics they can trust.
Explore FireAI workflows
Go from this topic into product features and solution paths that match what you read here.
Topic hub
Industry Analytics In India
Comparison pages and implementation guidance for industry-specific BI, dashboards, and analytics use cases in India.
Explore hubFrequently asked questions
Related in this topic
How Indian Distributors Track Beat Coverage
Learn how Indian distributors use BI tools to track beat coverage, secondary sales, outlet penetration, and salesman productivity. Practical guide with Tally and DMS integration.
7 Best BI Tools in India (2026)
Compare the best business intelligence tools for Indian businesses in 2026. See pricing features and which BI platform fits SMBs mid-market and enterprise.
What is a Sales Dashboard? Metrics and Examples
A sales dashboard is a visual tool that displays real-time sales performance metrics — revenue, pipeline, win rate, and team performance — on a single screen. Learn what to include in a sales dashboard and how to build one.
What is a KPI Dashboard? Definition and Examples
A KPI dashboard is a visual display of key performance indicators that gives business leaders an at-a-glance view of performance against goals. Learn what KPI dashboards include, how to build one, and see examples across sales, finance, and operations.
From the blog

Measuring Promotion Effectiveness: A Data-Driven Guide for FMCG Marketers
FMCG brands in India spend 15–25% of gross revenue on trade promotions and A&SP (advertising and sales promotion) every year. Most can tell you how much they spent. Very few can tell you what it returned. The problem isn't a lack of data — it's that the data lives in disconnected places. Trade spend sits in finance. Off-take data lives with the distributor or field team. A&SP budgets are tracked in a marketing spreadsheet. No single view ties promotional investment to consumer pull at the outlet level. The result is a budget cycle where last year's spend allocation becomes next year's default, because no one has the numbers to argue for something different. This guide walks through how FMCG marketing and trade teams can build a promotion effectiveness framework that actually connects spend to outcome — not just channel-level assumptions.

Multi-Outlet Retail Analytics: Track Store Sales
Track sales, stockouts, and staff performance across all stores. Learn how multi-outlet retail analytics can find the root cause of revenue leaks.
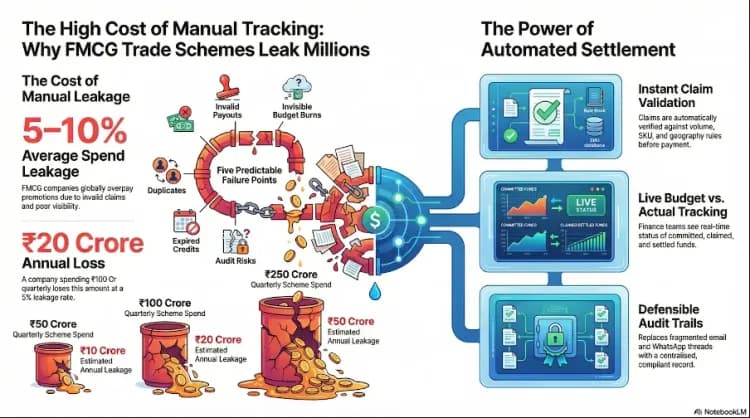
Trade Scheme Settlement: Why FMCG Companies Lose Crores to Manual Tracking
Manual tracking of FMCG trade schemes leads to 5–10% revenue leakage through errors, inefficiencies, and lack of visibility—costing companies crores every year.