Quick answer
GST return analytics tracks and reconciles data across GSTR-1, GSTR-3B, and GSTR-2B to monitor filing status, catch ITC mismatches, and track GST liability trends. FireAI auto-syncs Tally GST data and builds visual reconciliation dashboards — replacing the manual Excel cross-checking that causes missed credits and compliance notices for Indian businesses.
Need GST math right now? Use the free GST Calculator — handles CGST/SGST splits, IGST, and inclusive/exclusive amounts in your browser.
India's GST compliance requires businesses to reconcile data across multiple returns monthly — GSTR-1, GSTR-3B, GSTR-2A, and GSTR-2B. GST return analytics automates this reconciliation and gives a compliance dashboard that catches errors before they become notices. See Tally GST analytics and can AI automate GST reconciliation for related topics.
The GST Return Ecosystem
GSTR-1 (Outward Supplies)
Filed monthly or quarterly (for QRMP scheme). Contains:
- B2B invoice details (buyer GSTIN, invoice number, taxable value, tax)
- B2C large invoice details (inter-state sales above ₹2.5 lakh)
- B2C small aggregated supplies
- Credit and debit notes
- HSN-wise summary
GSTR-3B (Summary Return)
Filed monthly. Summarises:
- Output tax liability (CGST, SGST, IGST, Cess)
- ITC claimed (CGST, SGST, IGST, Cess)
- Tax payable after ITC set-off
- Exempt and nil-rated supplies
- Interest and late fee (if applicable)
GSTR-2A / GSTR-2B (Inward Supplies)
Auto-populated by the GST portal from your vendors' GSTR-1 filings:
- GSTR-2A is dynamic (updates as vendors file)
- GSTR-2B is static monthly statement (used for ITC claim)
What GST Return Analytics Tracks
Filing Status Dashboard
A calendar-style view showing:
- ✅ Filed on time
- ⚠️ Filed late (with late fee amount)
- ❌ Not yet filed (with days overdue)
For businesses with multiple GSTINs, this consolidated view prevents compliance lapses.
Output Tax Liability Trend
Monthly trend of GST output tax:
| Month | CGST (₹) | SGST (₹) | IGST (₹) | Total (₹) |
|---|---|---|---|---|
| Jan 2026 | 3,20,000 | 3,20,000 | 1,80,000 | 8,20,000 |
| Feb 2026 | 2,90,000 | 2,90,000 | 2,10,000 | 7,90,000 |
| Mar 2026 | 4,50,000 | 4,50,000 | 2,40,000 | 11,40,000 |
Spikes or dips relative to revenue trends may indicate data entry errors or classification issues.
ITC Reconciliation
The most critical GST analytics component. Reconciles three data sources:
- Books (Tally/ERP): ITC per your purchase register
- GSTR-2B: ITC available per the GST portal
- GSTR-3B: ITC actually claimed in the return
| Category | Books (₹) | GSTR-2B (₹) | GSTR-3B Claimed (₹) | Mismatch (₹) |
|---|---|---|---|---|
| Regular ITC | 5,80,000 | 5,50,000 | 5,50,000 | 30,000 |
| Reverse Charge | 45,000 | 45,000 | 45,000 | 0 |
| Import of Services | 20,000 | 20,000 | 15,000 | 5,000 |
| Total | 6,45,000 | 6,15,000 | 6,10,000 | 35,000 |
The ₹30,000 mismatch in regular ITC means vendors haven't uploaded ₹30,000 worth of invoices to their GSTR-1. The analytics dashboard identifies which specific vendors are responsible.
Vendor-Level ITC Mismatch
Drill down from the total mismatch to specific vendors:
- Vendors who haven't filed GSTR-1 at all
- Vendors who filed but with different amounts
- Vendors with incorrect GSTIN or invoice details
- Priority follow-up list ranked by mismatch amount
Advanced GST Analytics
HSN-Wise Tax Analysis
Track tax collected and ITC by HSN code. Identifies:
- Products with incorrect HSN classification (leading to wrong tax rate)
- Products where you're paying higher GST than competitors charge (classification review needed)
- HSN-wise compliance accuracy
Place of Supply Analytics
Inter-state vs intra-state sales classification affects whether IGST or CGST/SGST is charged. Analytics flags invoices where the place of supply may be incorrectly determined:
- Billing address and shipping address in different states
- Services where place of supply rules are complex
ITC Utilisation Optimisation
GST law prescribes the order of ITC utilisation (IGST first, then CGST against CGST, SGST against SGST). Analytics checks whether your GSTR-3B filing follows the optimal utilisation order that minimises cash outflow.
Annual Return (GSTR-9) Preparation
At year-end, analytics reconciles all monthly GSTR-1 and GSTR-3B filings with books to prepare accurate GSTR-9 data — catching cumulative mismatches before the annual return is filed.
GST Analytics for Different Business Profiles
Multi-State Businesses
Separate GSTIN for each state. Analytics consolidates compliance status, ITC reconciliation, and filing calendars across all GSTINs into a single dashboard.
Exporters
Track LUT (Letter of Undertaking) validity, export invoice GST refund claims, and zero-rated supply classification accuracy.
Composition Scheme Dealers
Track quarterly CMP-08 filings, annual GSTR-4 preparation, and threshold monitoring (₹1.5 Crore turnover limit).
E-Commerce Sellers
Track TCS (Tax Collected at Source) by marketplace, reconcile marketplace GSTR-8 with your own GSTR-3B, and monitor ITC from marketplace commissions.
How FireAI Helps
FireAI's one-click Tally connector auto-syncs all GST-related voucher data from Tally Prime — sales, purchases, tax ledgers, and HSN classifications — without CSV exports or manual data preparation. The zero-code platform provides pre-built GST analytics dashboards that are ready within minutes of connecting.
Key FireAI capabilities for GST return analytics:
- Pre-built GST dashboard templates: GSTR-1 summary, GSTR-3B liability view, ITC reconciliation, and filing status tracker — all ready out of the box
- Real-time auto-sync: Dashboards update as vouchers are posted in Tally — no end-of-month export marathons
- Natural language queries (NLQ): Ask "Which vendors have ITC mismatch above ₹10,000 for March?" or "Show my GST liability trend for the last 6 months" and get instant visual answers
- Multi-GSTIN consolidation: Businesses with state-wise registrations see all GSTINs on one compliance calendar
- Automated alerts: Get notified when ITC mismatch exceeds threshold, filing deadlines approach, or liability spikes unexpectedly
Example: A pharmaceutical distributor in Hyderabad with 3 GSTINs was losing ₹2–3 lakh per quarter in unclaimed ITC because vendor invoices weren't appearing on GSTR-2B. After connecting Tally to FireAI, the dashboard flagged mismatched vendors within seconds — the team recovered ₹2.8 lakh in the first quarter by following up with specific suppliers before filing.
Ready to act on your data?
See how teams use FireAI to ask in plain language and get analytics they can trust.
Explore FireAI workflows
Go from this topic into product features and solution paths that match what you read here.
Topic hub
Tally Analytics
Analytics for Tally Prime and Tally ERP — one of 250+ data sources FireAI connects to — including dashboards, reporting, GST, and finance workflows.
Explore hubFrequently asked questions
Related in this topic
Tally Analytics: Turn Tally Data into Dashboards & Reports
Get AI-powered analytics and dashboards from Tally Prime data without SQL. FireAI connects to Tally for live GST, sales, inventory, and P&L—no spreadsheet exports.
Tally GST Analytics: Compliance, Returns & ITC Tracking
Use Tally GST analytics to track GSTR-1, GSTR-3B filings, ITC reconciliation, and compliance status from your Tally Prime data. Dashboards for Indian GST compliance.
What is a Financial Dashboard? Metrics and Examples
A financial dashboard displays key financial metrics — revenue, margin, cash flow, and expenses — in real time on a single screen. Learn what to include in a financial dashboard and how to build one from Tally or your accounting system.
Can AI Automate GST Reconciliation from Tally Data?
Yes — AI can automate GST reconciliation by matching your Tally purchase register against GSTR-2B data, flagging mismatches, and tracking ITC discrepancies in real time.
From the blog
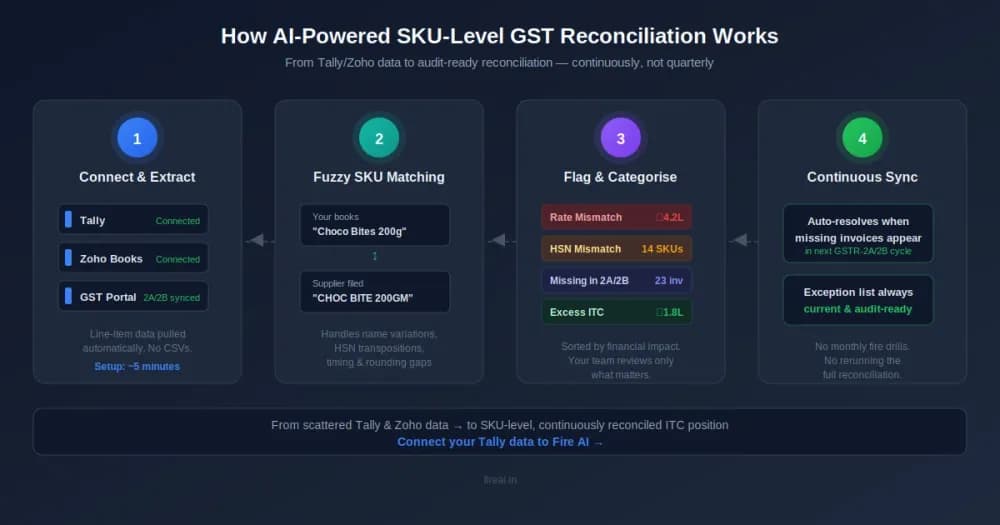
GST Credit Reconciliation by SKU: An AI-Powered Approach for FMCG
Your invoice totals match. Your GSTR-2A looks clean. But buried three levels down, at the SKU level, there's ₹14 lakh in ITC you either shouldn't have claimed — or haven't claimed at all. Here's how AI surfaces what spreadsheets can't.

What is a KPI dashboard and why does every Indian business need one?
Still piecing together your business numbers from WhatsApp messages and old Excel files? Here is why a KPI dashboard changes everything for Indian businesses.

CFO’s AI Analytics Guide 2026: From Monthly Close to Real Time
A working CFO AI analytics guide: replace the monthly close lag with real-time financial analytics, AI FP&A automation, and a CFO dashboard that decides.