Get Started
User manual
User Manual For FireAI
Updated July 1, 2026
How to think about FireAI?
What FireAI is not
FireAI is not a general-purpose conversational tool, like ChatGPT. It does not consult the open internet, hold an independent point of view, or fabricate answers from material outside your own data. It is not an autopilot; it works only when you direct it to a question worth examining. The more specific you are about what you want to look at, the more precise the analysis it can return.
What FireAI is
FireAI is a working layer that sits on top of your own business data. It arrives with dashboards tailored to your organisation, KPIs that matter to you, business metrics arranged into views that mirror how your team thinks and decides. Alongside these dashboards is our LLM, an AI agent you can address in layman English, asking questions about the numbers in front of you with it's thinking ability, drilling from any figure into the records that produced it using it's back & forward linking causation layer, and leaving comments on anything worth flagging for a colleague.
What it fills in for you
FireAI replaces the routine of pulling MIS, hunting through spreadsheets, and waiting on someone else to fetch a number. It keeps the dashboard and the explanation of it in the same place, so you are not switching between a report and a deck. It brings together views that would otherwise be scattered across teams and tools. And it closes the gap between asking a business question and getting an answer you can actually act on.
In addition, our Causal AI Decision Intelligence is the next layer of the AI stack — one that lets agents run counterfactual what-ifs, test interventions, and deliver explainable, auditable, decision-grade outputs that humans can actually act on.
_
FireAI doesn't guess — it investigates. You point, it analyses._
Getting around FireAI
Five steps, from opening the app to acting on what you find.
Step 1. Open the app
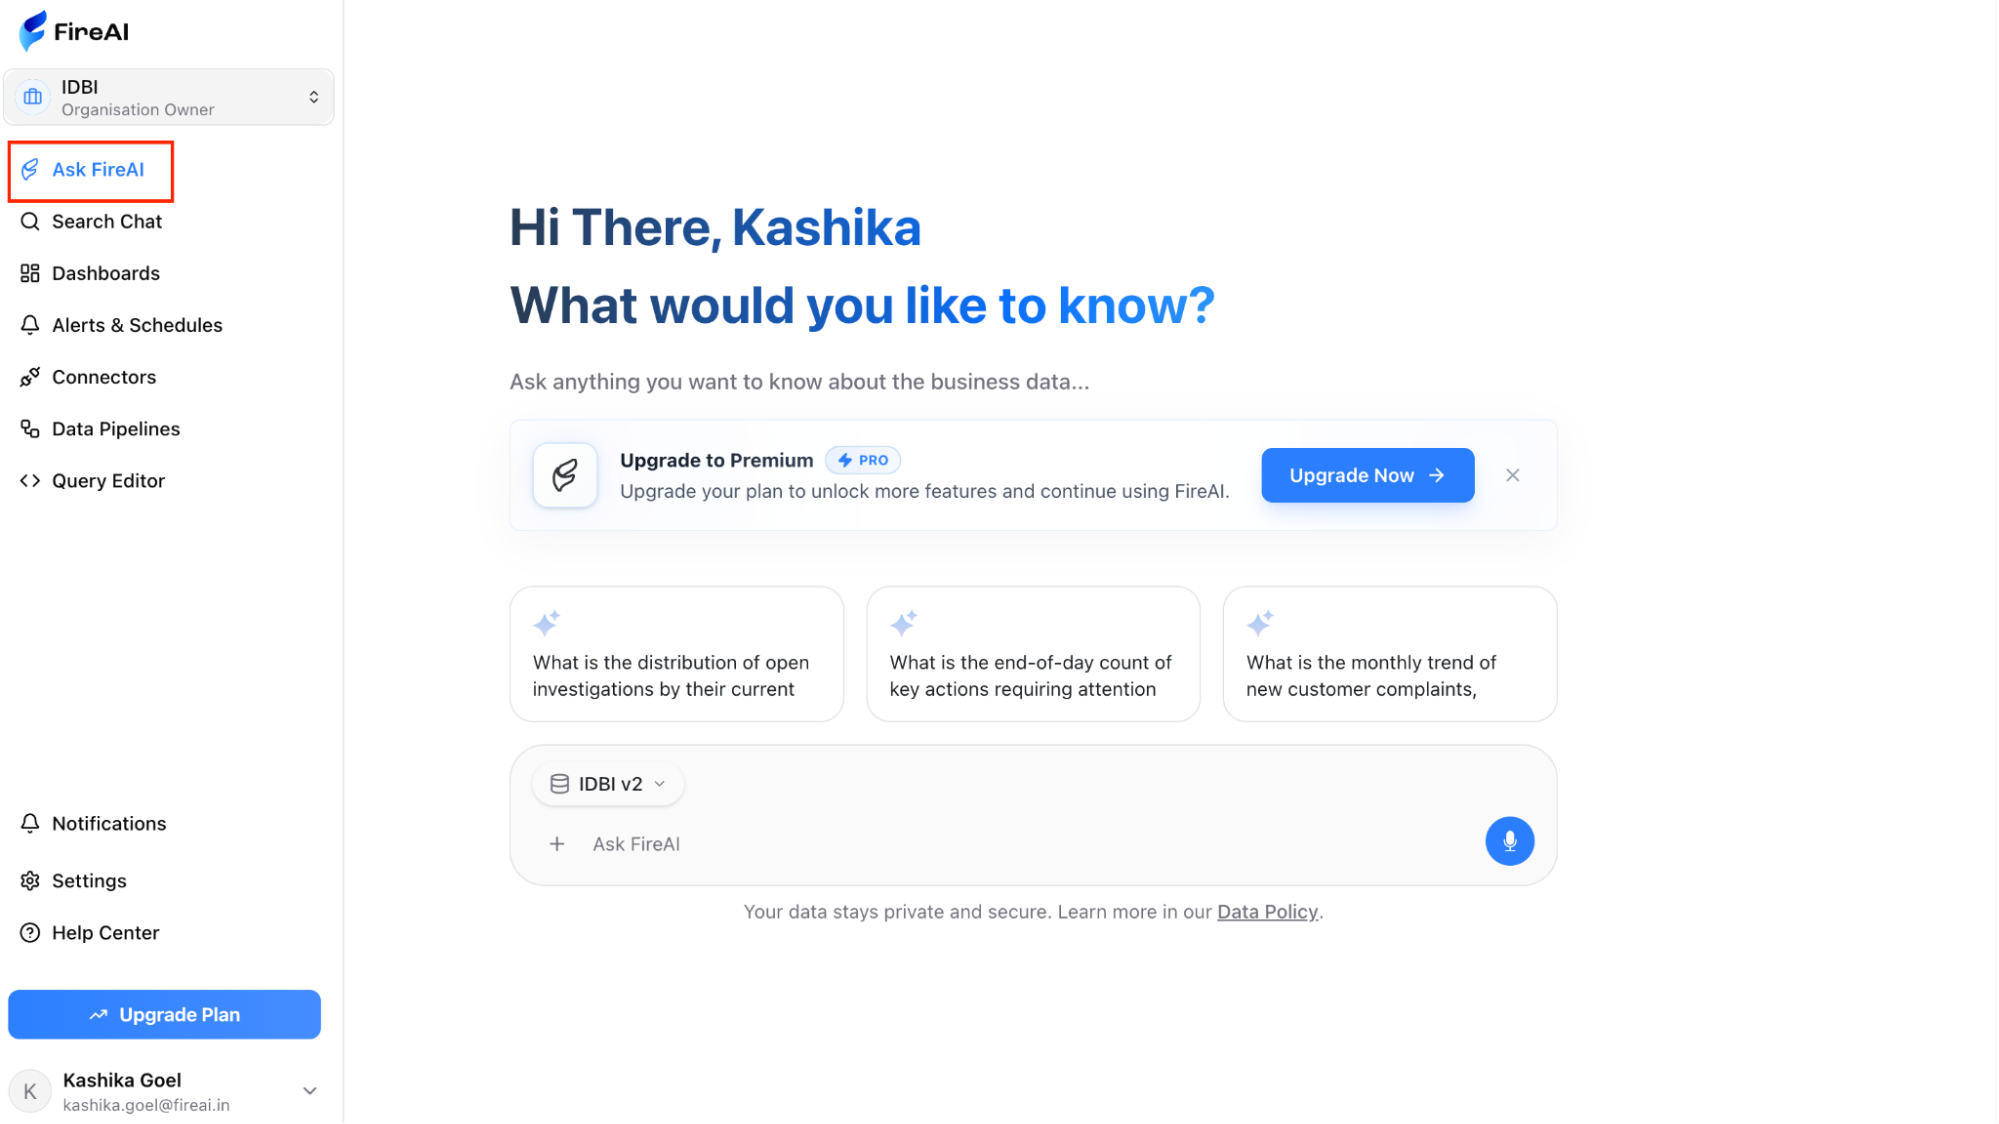
Sign in and you are greeted by a navigation bar on the left bar, with shortcuts to Ask FireAI, Search, Reports, and Dashboards, among others.
Step 2. Open Ask FireAI
Ask FireAI chat interface
Ask FireAI is the first place to start, an open chat where you put a business question to the AI in layman English. You phrase the question naturally, and the AI runs the analysis on your data and returns the answer with a chart.
The conversational layer holds context between turns, so a follow-up question builds on the previous response without you having to restate where you started. You can narrow the slice, push the question further, or compare a second segment, and the chat carries the thread through. Every reply arrives with the chart, the underlying numbers, and the reasoning steps the AI took to get there, so the analysis is always visible rather than a black box. What looks like a chat is, underneath, a full analytical loop of question, data fetch, computation, visualisation, and explanation, all running in a single window.
Step 3. Open the dashboard you need
Dashboard navigation sidebarDashboard list view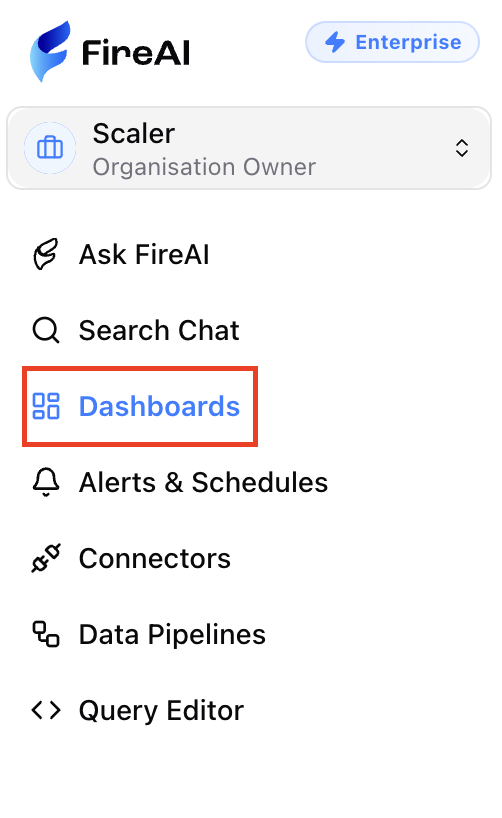
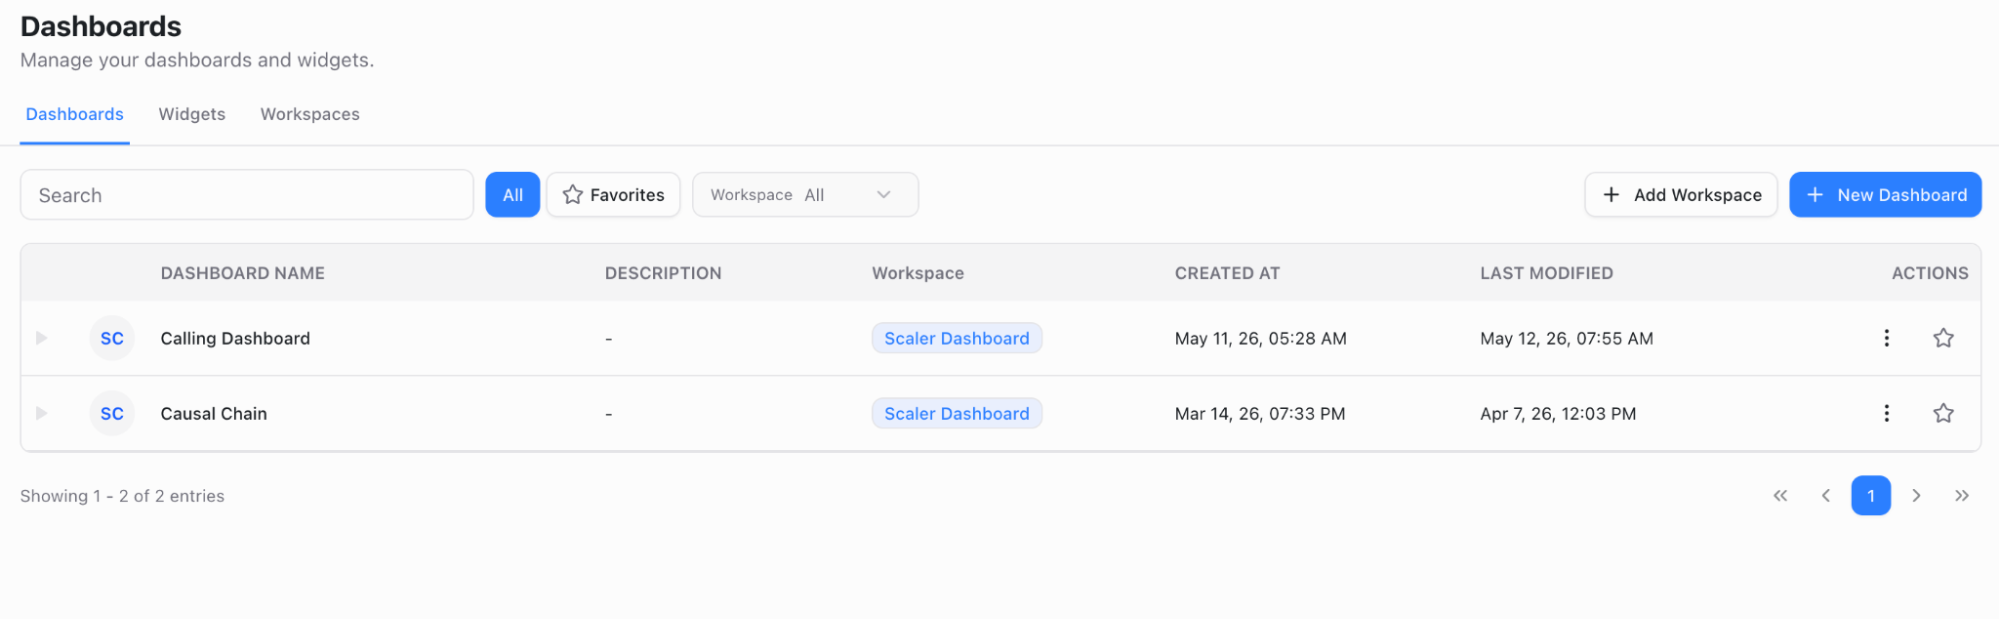
For the moments when no specific question comes to mind but you still want to make sense of your numbers, the dashboard is the place to begin. A dashboard opens as a multi-tab view. The headline KPIs sit across the top. The charts, tables, and supporting visuals sit below. Here's a dashboard view for your reference.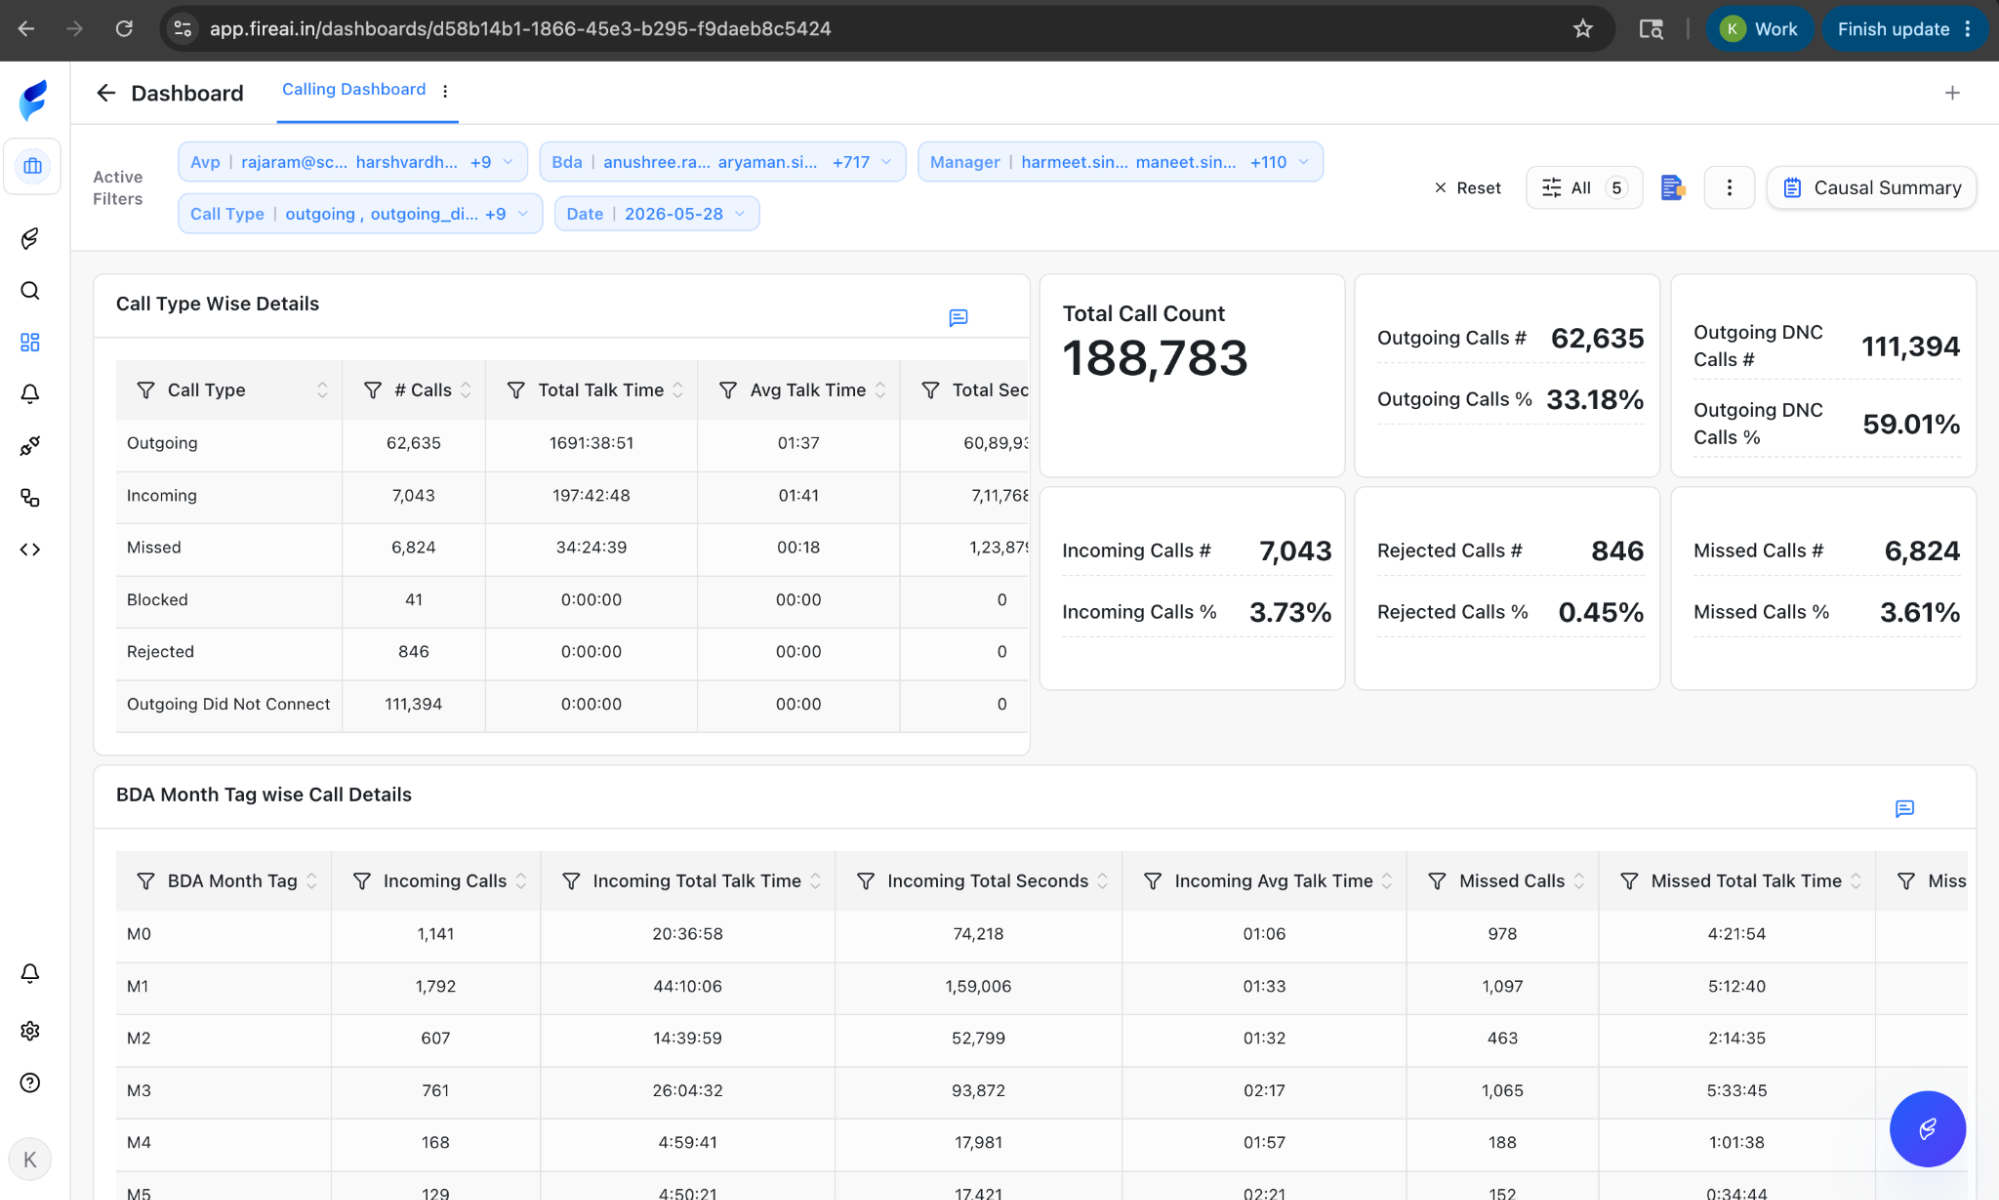
Dashboard with KPIs and charts
Step 4. Set what you are looking at
Use the filter bar to narrow the view. Set the time range, choose a region, a team, a product, or any other dimension that fits your question. The whole dashboard adjusts to the filters you apply, so what you see is the slice you actually care about.
Step 5. Choose how you want to ask
Barring our conversational layer (i.e., Ask FireAI), there are three ways to put a question to FireAI, each suited to a different kind of inquiry.
CXO Agent Report — a polished, executive-style summary of the entire dashboard, complete with KPI impact analysis and recommendations, ready to print or share with leadership. Click on Dashboard summary, to be directed to “Auxiliary Questions - Calling Dashboard”, and generated an overall CXO Summary.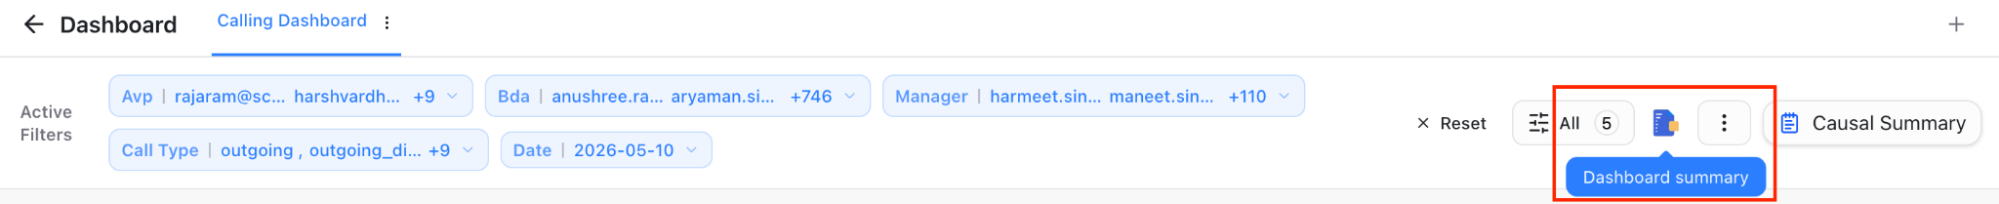
Dashboard summary buttonCXO Agent Report output
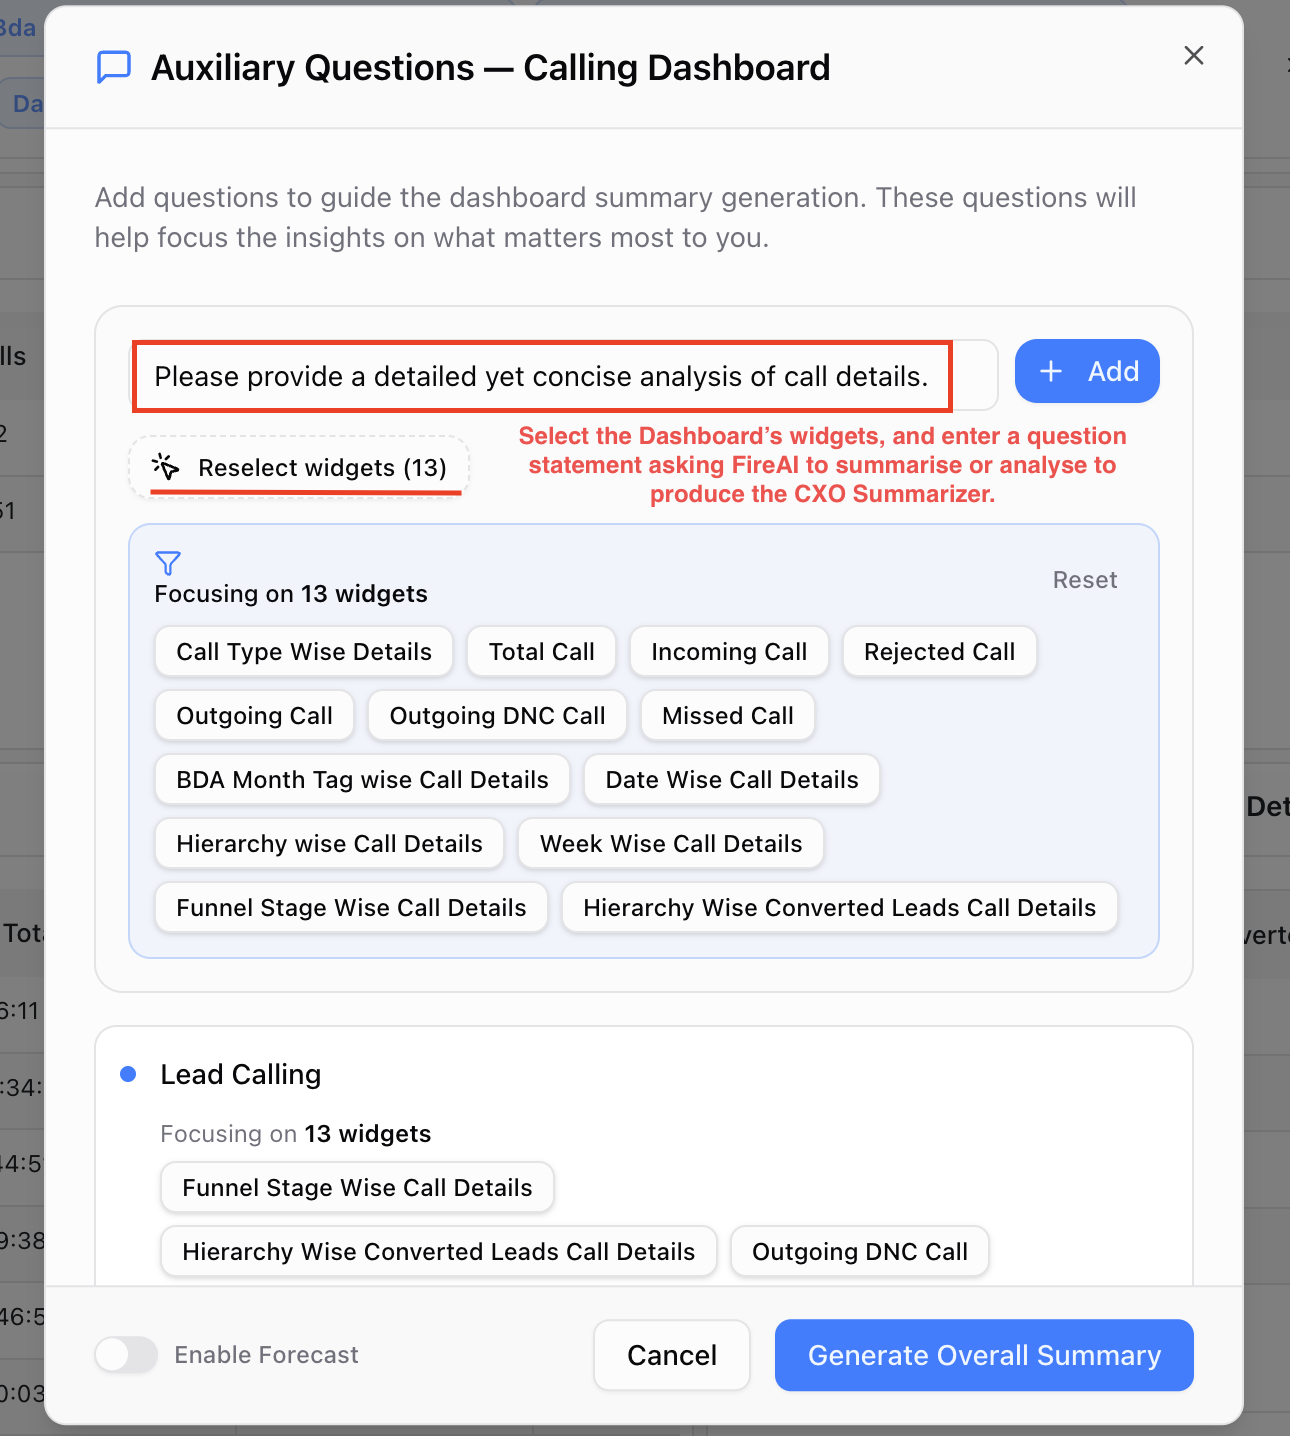
Auxiliary Analysis Report — a deeper deep-dive on a single theme, structured as performance overview, hierarchy analysis, top-impact contributors, and strategic recommendations, generated in one go. Here's how to generate the auxiliary report.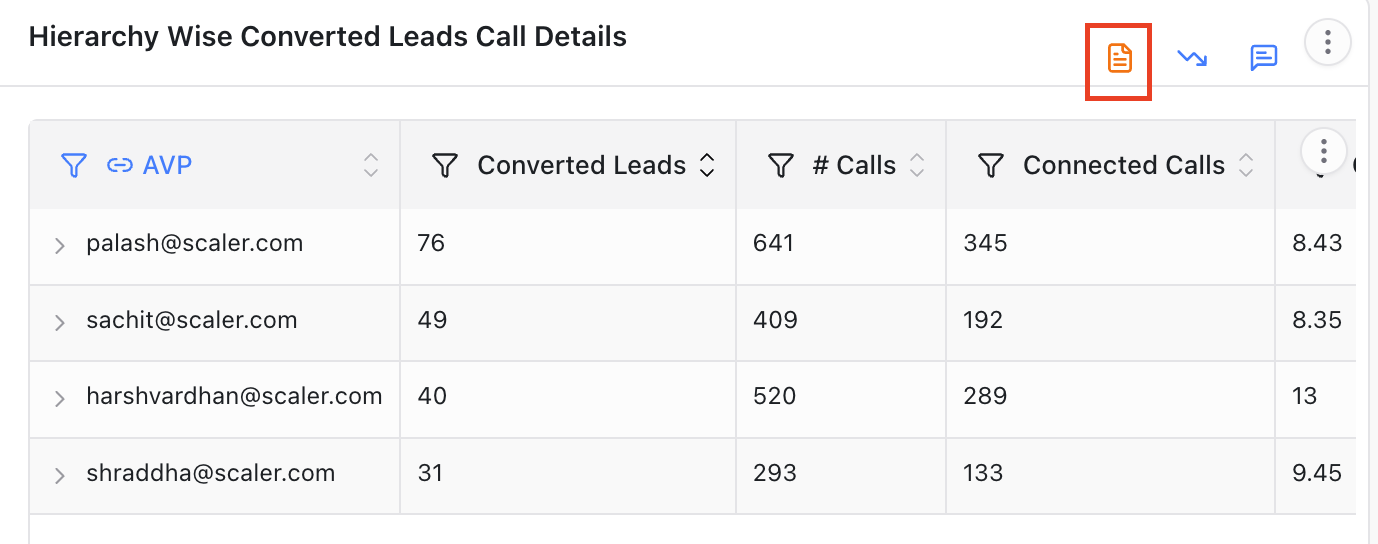
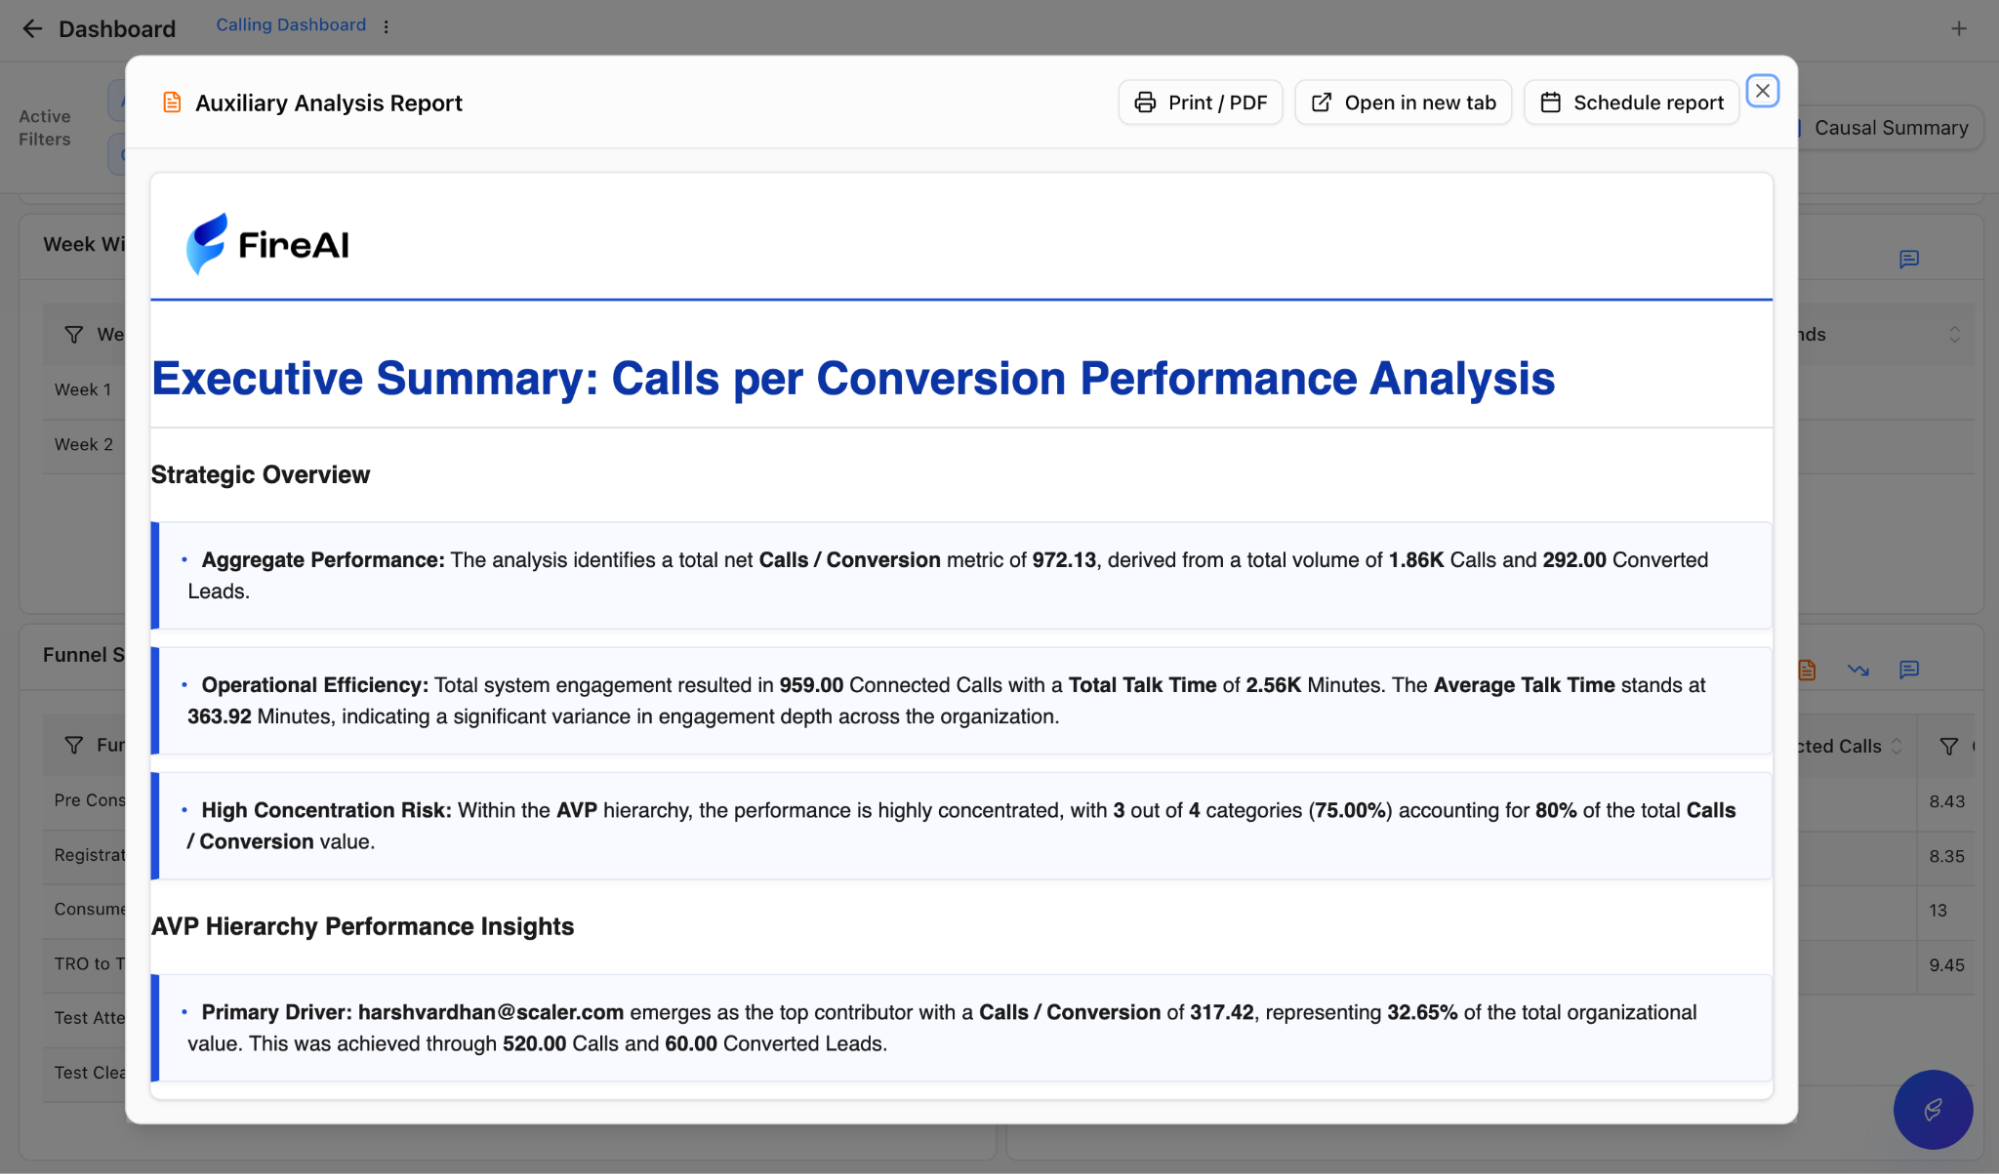
Generating auxiliary analysis reportAuxiliary analysis report output
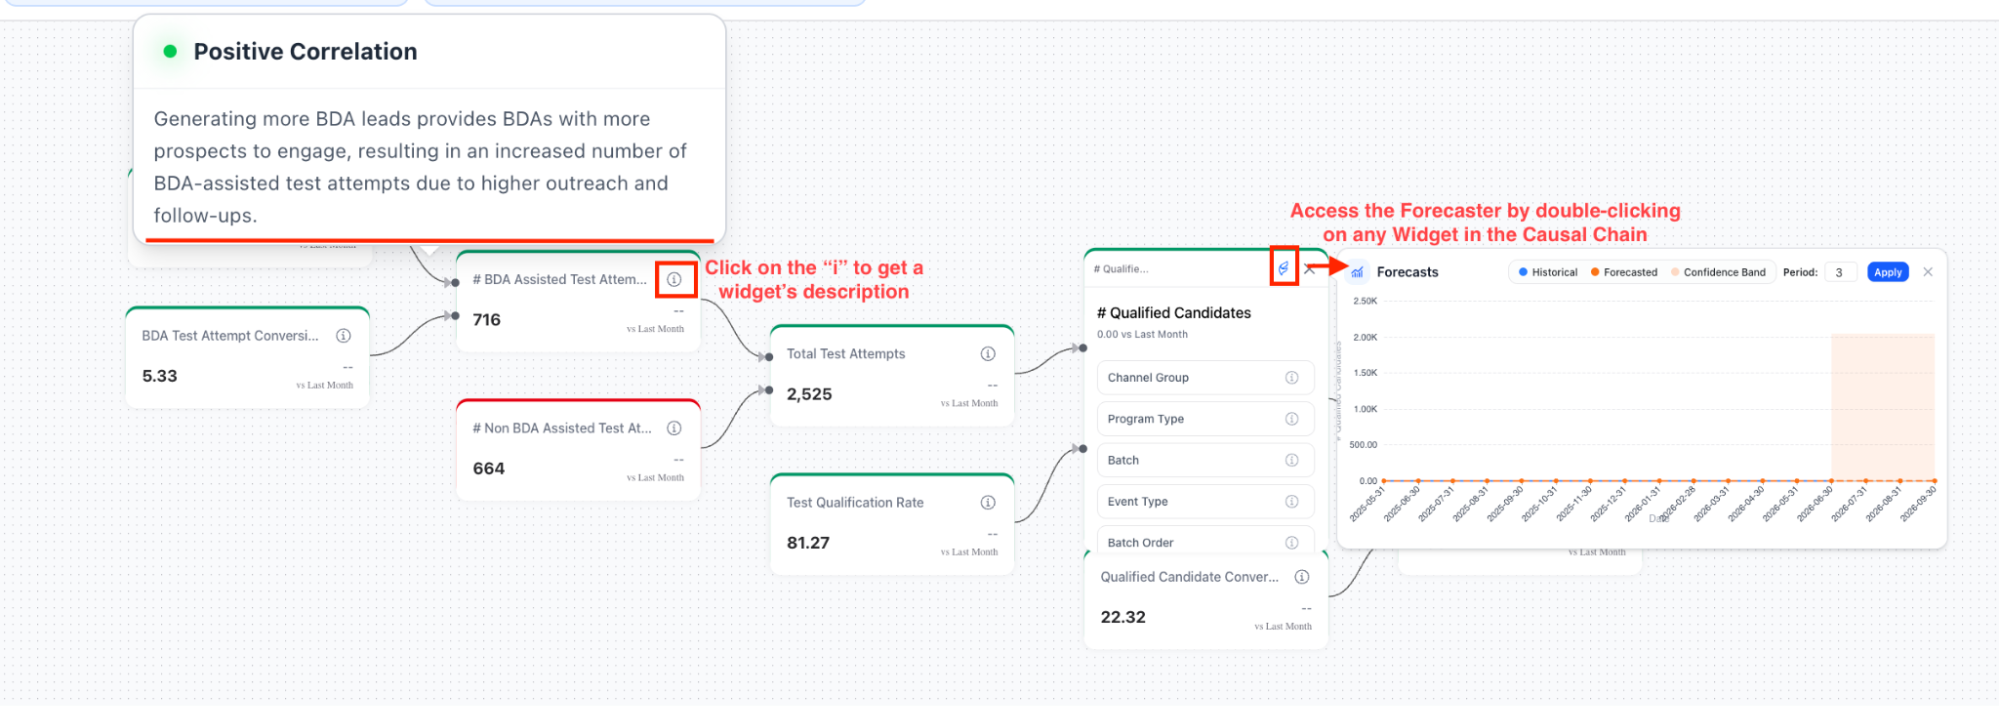
Causal Summary — a flowchart that studies causation across the dashboard, tracing how key metrics cause and feed into one another both forward, through what follows, and backward, through what led up to a number. Click into any node and a written explanation opens up for that event, with its drivers and consequences laid out. Activate the Forecaster on any node in the causal chain to predict trends, and understand how long the current flow is likely to persist.
Causal summary flowchartCausal node detail view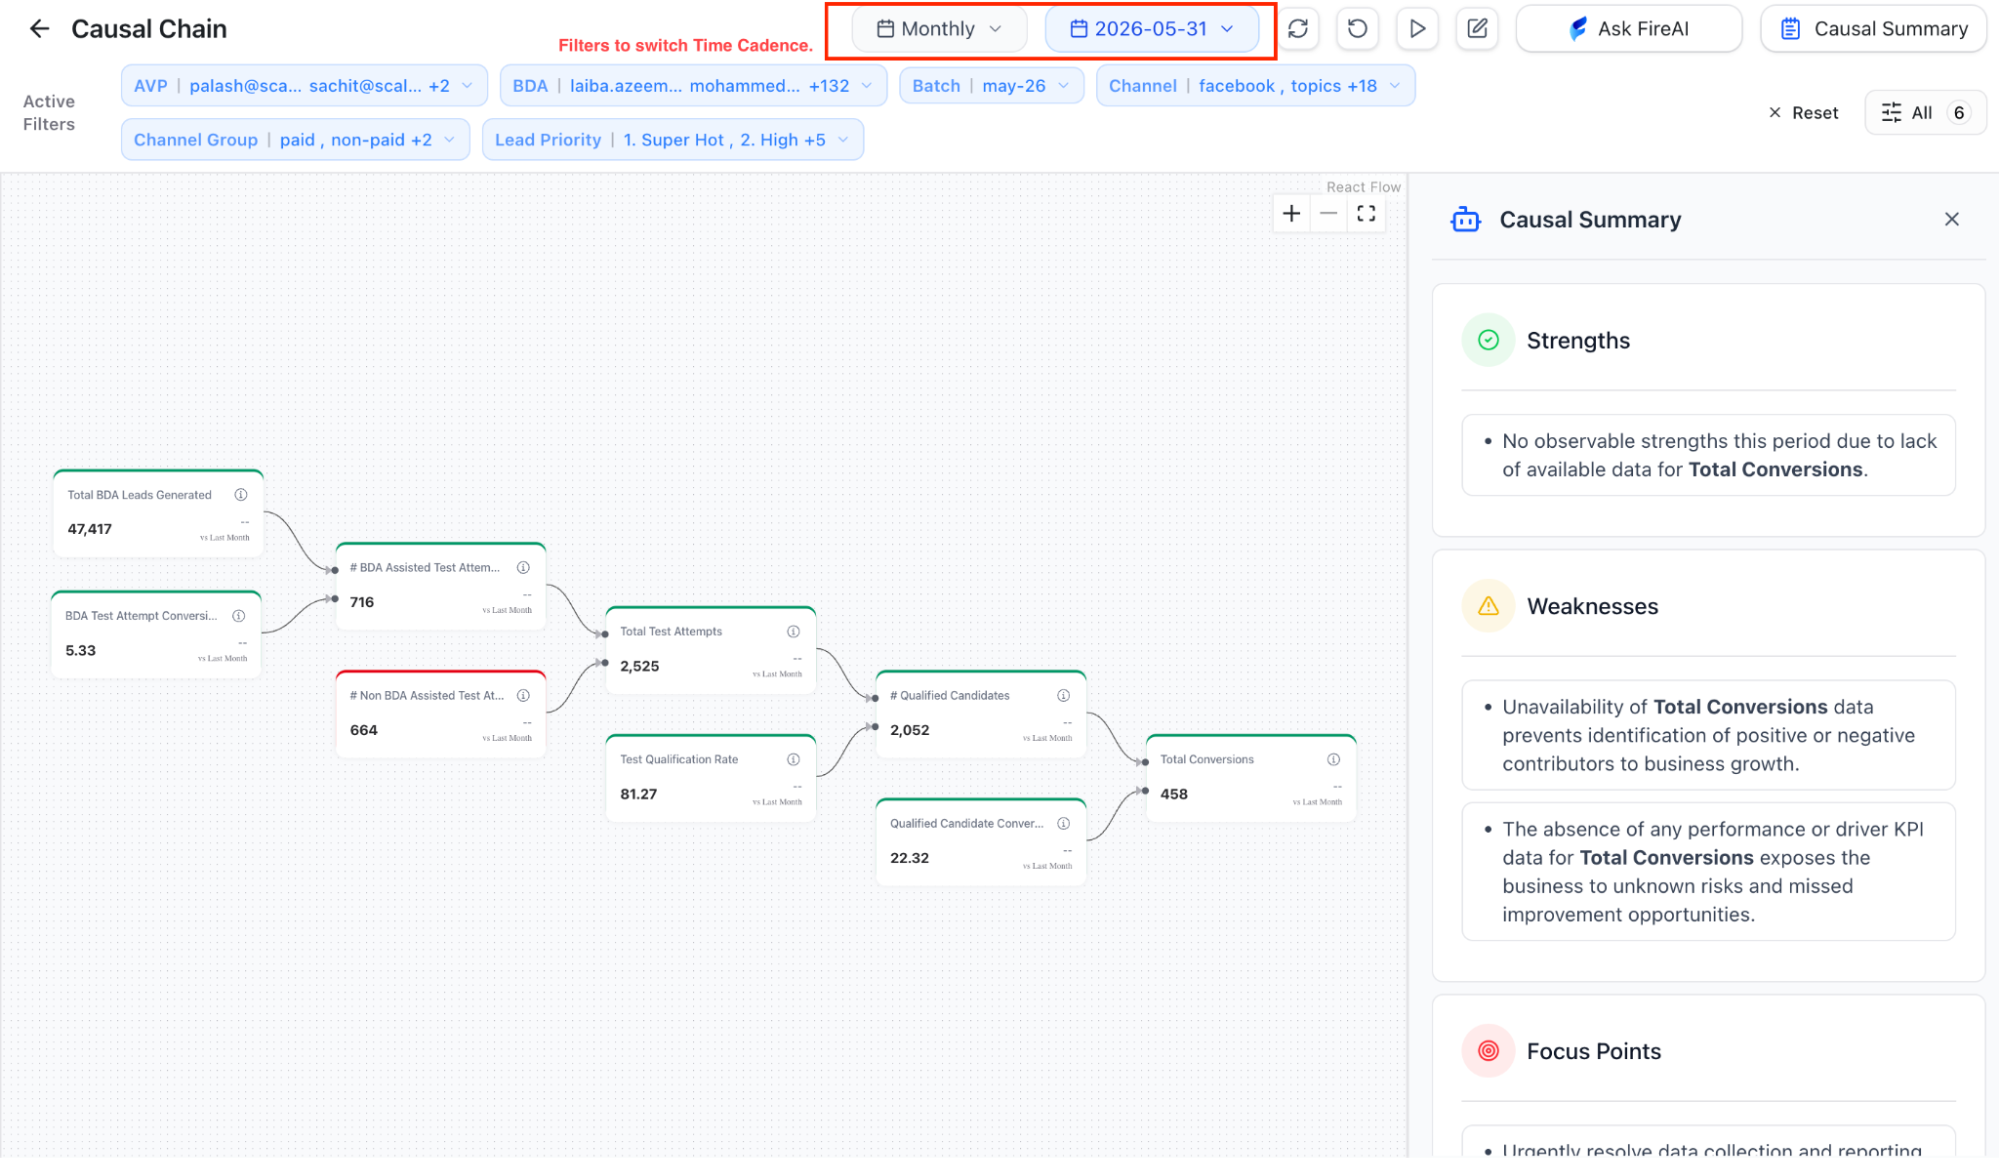
Reading, drilling, and exporting
Step 5. Read, drill, export
Read the answer carefully, then drill into the parts that matter. If a sales chart shows a dip in revenue for last month, you can click on that bar to break it down by day, and then drill further into a specific day to see the SKUs, customers, or branches that drove the change. The same drill works in either direction, from a regional total down to the branch, from a category down to the product, from a quarter down to the day.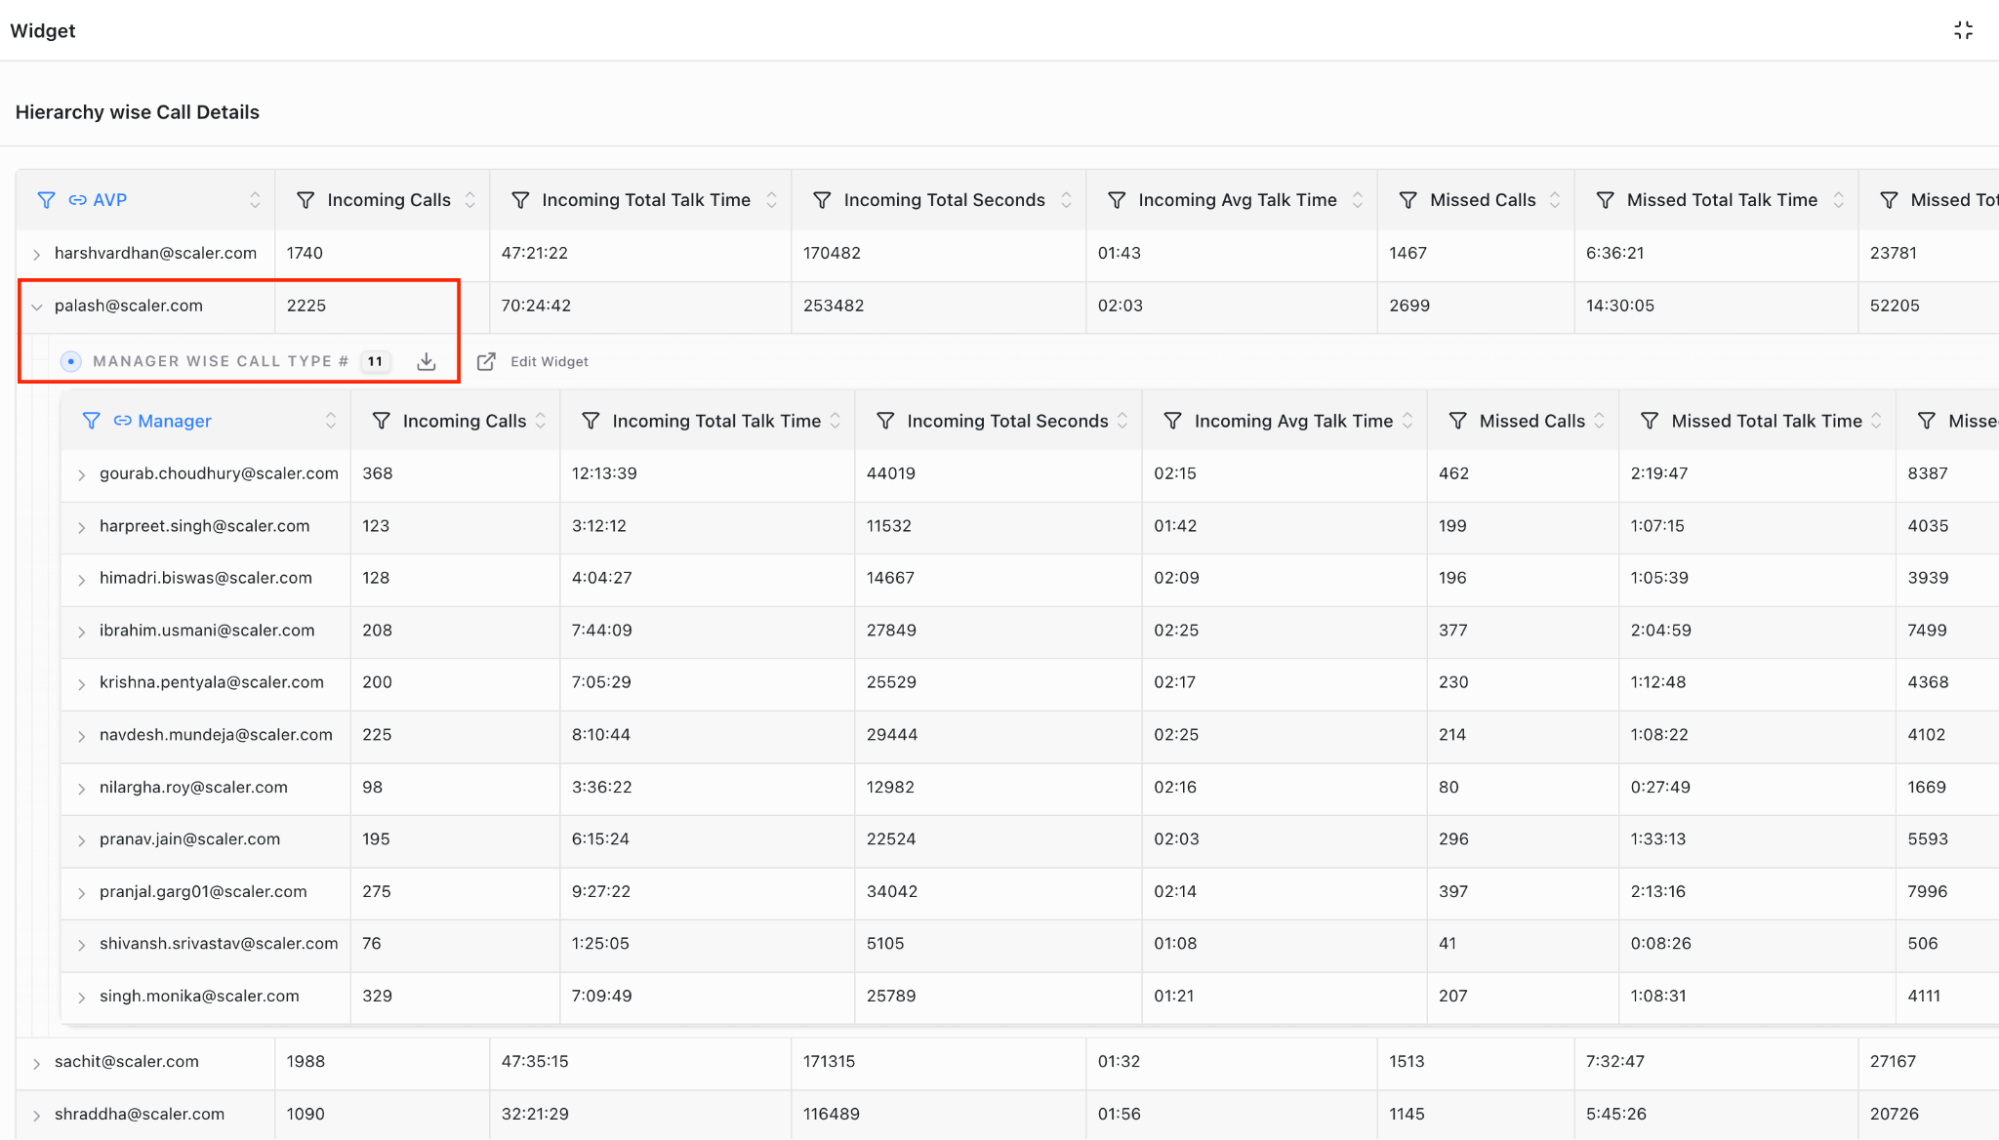
For a deeper, conversational drill, activate the Investigation Agent inside Ask FireAI; it dives into the data and follows your follow-up questions all the way down to the underlying records. Each layer reveals the business logic behind the headline number, so by the time you reach those records, the cause of the figure is plain. If a view is worth keeping, save the chat or export the dashboard as a PDF. Both stay with you after you close the app. Here's a sample drill-down:
Drill-down sample view
Our recently introduced Looper Mode takes the drill further. It works through your question step by step, thinking, checking, and improving as it goes, pulling and analysing data, while searching the internet, and using semantic match where it helps. Rather than returning a quick answer, it keeps iterating until the analysis genuinely holds up, the way a careful analyst would. Here's where to find Investigation Agent and Looper Mode:
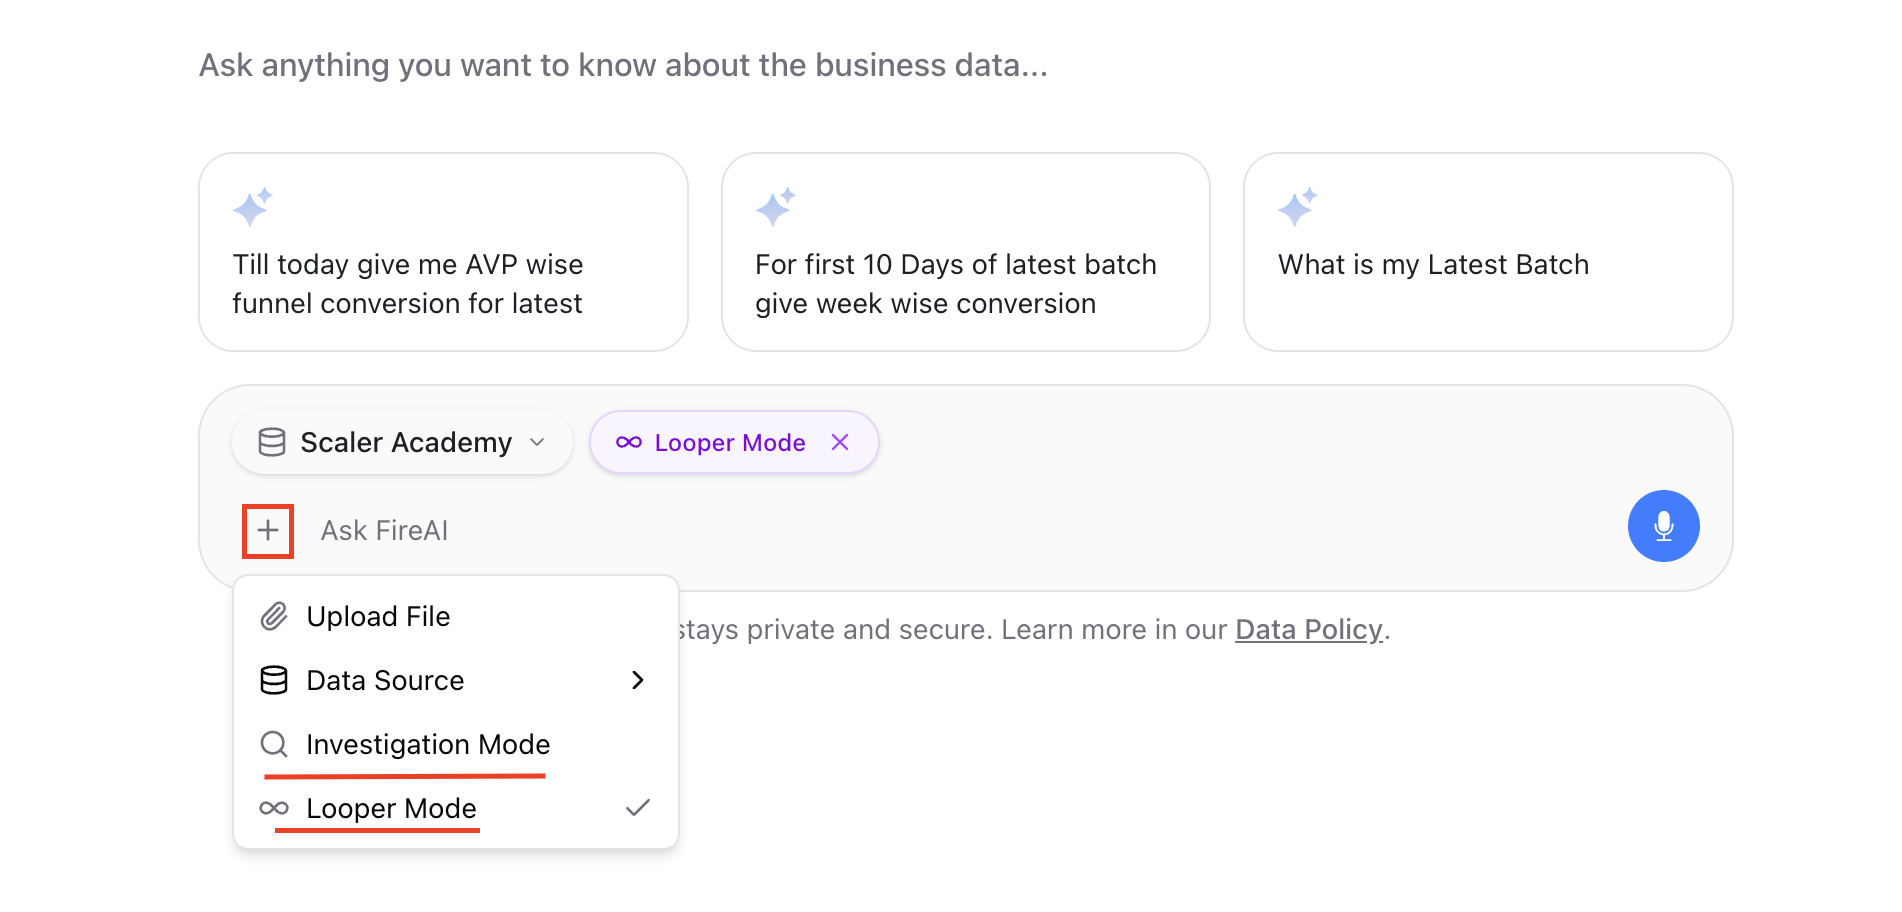
Investigation Agent and Looper Mode
Habits that make FireAI work for you
These are not rules. They are a short list of habits that help you get to a useful answer faster.
Tell it the time range. “Last quarter,” “this year to date,” and “the same month last year” are very different answers — be explicit about which one you want.
Use the suggested questions when you are not sure where to begin. They are there because they tend to surface the most useful angles.
Narrow the view before you ask. Filter to your region, your team, or your product line so the answer is about your slice, not the whole organisation.
Ask focused questions. A comparison lands better in a single sentence — “How does Region A compare to Region B for last quarter?” than as two separate questions.
Save anything worth coming back to. Chats persist, and PDFs export cleanly. Neither disappears when you close the tab or the app.
Leave a comment on a panel if you want a colleague to see what you found. The comment stays with the data, so the thread does not get lost in email.
FireAI rewards a clear ask. Set the context, ask the question, and it does the rest.