Quick answer
Trade promotion analytics measures how discounts, display fees, and schemes change offtake, revenue, and margin after trade spend. For FMCG, it links DMS or billing data to promotion calendars to show lift, cost per incremental case, and ROI by scheme, region, and outlet. The goal is to know which promotions pay back before year-end scheme settlement, not after.
Trade promotion analytics is the practice of measuring how much extra volume and margin your trade marketing spend actually buys, and whether that spend is efficient compared to doing nothing or running a different scheme. In FMCG, "trade" usually means money you give retailers or distributors (discounts, billbacks, display rentals, free goods) in exchange for shelf space, offtake, and visibility.
Indian brands run hundreds of parallel schemes across territories. Without analytics, trade spend becomes a large line item that finance reconciles at quarter end while sales argues about which promotions "worked." Analytics tightens that loop to weeks or days. For a broader FMCG context, start with FMCG analytics in India and the marketing depth in FMCG marketing use cases.
What Counts as a Trade Promotion?
Common promotion types in FMCG include price-offs, display schemes, buy-get structures, and performance-linked payouts to the trade. Each type needs different data to evaluate honestly.
- Retailer or distributor discount: reduced invoice price or post-invoice credit (billback) for moving agreed volumes
- In-store display and visibility: gondola ends, danglers, and shelf fees where you pay for placement, not just price
- Bundle or multi-pack schemes: "buy 10 get 1" or category basket targets that show up in secondary sales
- Route or beat contests: short-term spiffs for field teams linked to offtake in covered outlets
- Modern trade and general trade specific packs: MRP, pack size, and promo calendars that differ by channel
Trade promotion analytics does not replace brand advertising analytics. It is specifically about spend and rules agreed with the trade and the offtake and margin that follow at outlet or stockist level when possible.
How Promotion Effectiveness Is Measured
Effectiveness means linking a defined promotion period and territory to a measurable lift in offtake or revenue, net of the cost of the scheme. A few building blocks show up in almost every serious FMCG dashboard.
| Metric | What it answers |
|---|---|
| Baseline vs promoted offtake | Are you moving more units than you would have without the scheme? |
| Incremental volume / value | How much of the total volume during the window is "extra" vs expected run rate? |
| Trade rate / cost of promotion | Total scheme cost divided by relevant sales (e.g. ₹ per case or % of sell-in value) |
| Payout timeliness and leakage | How much of committed discount reached the right counterparty; critical before claiming ROI |
| By outlet or beat (when DMS allows) | Which routes or stores respond so you can repeat winners and cut laggards |
Baseline methods vary by data maturity: some teams use pre-period averages, same period last year, or control geographies. The important part is consistency so commercial and finance can compare one scheme to another. For how secondary movement ties to the field, see field force analytics in FMCG.
ROI and Trade Spend Analytics
ROI for a trade scheme is the incremental gross margin (or contribution) generated by the promotion, divided by the cost of the promotion, for the same window and scope. Simpler "sales divided by spend" numbers can look good but hide margin erosion if you are funding deep discounts on low-margin SKUs.
A practical stack for trade ROI:
- Define the promotion window and geography (scheme master in Excel or the DMS, whatever is the source of truth)
- Load sell-in and, where available, sell-out from the distributor management system (DMS) or retailer feeds
- Capture scheme cost including free goods, billbacks, and estimated display fees
- Attribute lift using a baseline and agreed rules for cannibalization across overlapping schemes
- Review by SKU, pack, and channel so a "national" roll-up does not mask bleeding regions
Trade spend analytics is the same family of work at portfolio level: total trade as a percent of net sales, spend by brand and channel, and year-on-year change versus category growth. That is how management asks whether the overall promotion engine is getting cheaper or more expensive per rupee of growth.
Settlement reality in India: many disputes sit in claim matching between what the company thinks it owes and what distributors recorded. A clear read on trade scheme settlement and reconciliation starts with data alignment before the negotiation. Analytics makes those conversations faster because both sides can see the same numbers at outlet or invoice grain where the system allows.
How FireAI Tracks Scheme Performance from DMS Data
FireAI connects to primary billing and DMS exports, maps SKUs and outlets to your promotion master, and keeps dashboards for lift, cost per case, and ROI by scheme without manual month-end file merges. Typical integration points are distributor invoices, returns, and stockist-level secondary where the data is clean enough; field beat plans add context for route-level views.
What teams ask in plain language (examples):
- "Show ROI for the July modern trade multibuy in West versus North."
- "Which five schemes had negative incremental margin last quarter?"
- "What is our trade spend as a percent of net sales for the beverages portfolio this year vs last?"
Operational outcomes include earlier cuts to underperforming schemes, fewer surprise settlements, and a shared number between sales, trade marketing, and finance before the quarter closes. When promotion timing affects stock placement, you can combine these views with demand forecasting to avoid over-production ahead of a weak scheme.
For marketing mix outside pure trade, marketing analytics dashboards and cohort-style tools (for example RFM analysis) help separate trade-led spikes from long-term customer value, so you do not over-credit a short discount window.
Ready to act on your data?
See how teams use FireAI to ask in plain language and get analytics they can trust.
Explore FireAI workflows
Go from this topic into product features and solution paths that match what you read here.
Topic hub
Industry Analytics In India
Comparison pages and implementation guidance for industry-specific BI, dashboards, and analytics use cases in India.
Explore hubFrequently asked questions
Related in this topic
FMCG Analytics in India: Sales & Distribution
FMCG analytics in India covers secondary sales tracking, distributor performance, beat coverage, and retailer segmentation. Learn key metrics for Indian FMCG companies.
What is Demand Forecasting? Methods and AI Techniques
Demand forecasting uses historical sales data and statistical or AI models to predict future product demand. Learn the key methods — time series, causal, and machine learning — and how tools like FireAI automate demand planning directly from Tally and DMS data.
What Is Field Force Analytics in FMCG? Metrics & Meaning
Field force analytics in FMCG measures how sales teams perform in the field: visits, outlet coverage, orders per call, and productivity. Learn the core metrics and how FireAI builds dashboards from DMS and CRM data.
What is a Marketing Analytics Dashboard?
A marketing analytics dashboard consolidates campaign performance, channel attribution, lead generation, and CAC metrics in one view. Learn what to include in a marketing dashboard and how to measure marketing ROI effectively.
From the blog

Measuring Promotion Effectiveness: A Data-Driven Guide for FMCG Marketers
FMCG brands in India spend 15–25% of gross revenue on trade promotions and A&SP (advertising and sales promotion) every year. Most can tell you how much they spent. Very few can tell you what it returned. The problem isn't a lack of data — it's that the data lives in disconnected places. Trade spend sits in finance. Off-take data lives with the distributor or field team. A&SP budgets are tracked in a marketing spreadsheet. No single view ties promotional investment to consumer pull at the outlet level. The result is a budget cycle where last year's spend allocation becomes next year's default, because no one has the numbers to argue for something different. This guide walks through how FMCG marketing and trade teams can build a promotion effectiveness framework that actually connects spend to outcome — not just channel-level assumptions.
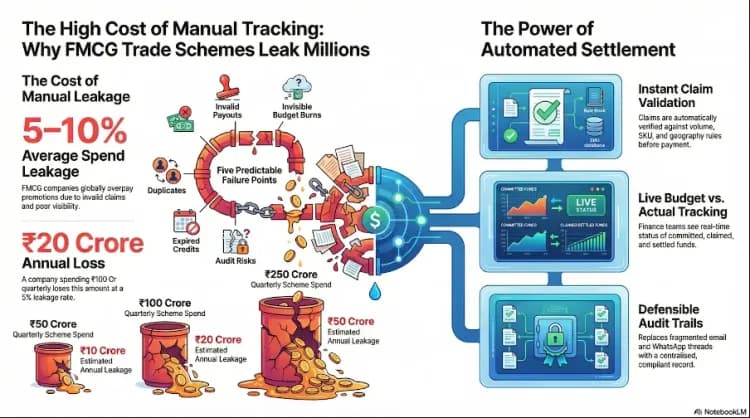
Trade Scheme Settlement: Why FMCG Companies Lose Crores to Manual Tracking
Manual tracking of FMCG trade schemes leads to 5–10% revenue leakage through errors, inefficiencies, and lack of visibility—costing companies crores every year.

How AI-Powered Analytics Can Transform India’s Arbitration Bottleneck?
AI-powered analytics can transform India's arbitration system by automating case classification, predicting timelines, and optimizing arbitrator allocation to cut delays.