Quick answer
Unit economics measures the revenue and costs tied to a single customer or order to determine whether your business model is profitable at scale. For D2C brands, the four core metrics are CAC (cost to acquire a customer), LTV (lifetime revenue from that customer), LTV:CAC ratio, and payback period. A healthy D2C business targets LTV:CAC above 3x and payback under 12 months.
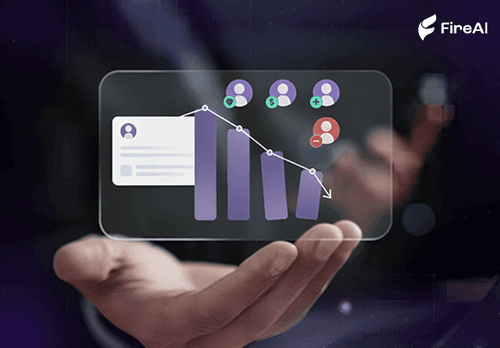
Unit economics is the financial analysis of a single unit of your business — one customer, one order, or one SKU — to determine whether growth makes you more or less profitable. If your unit economics are negative, scaling only accelerates losses. If they are positive and improving, growth compounds your advantage.
For D2C and e-commerce brands in India, unit economics have become the central profitability conversation. Gross merchandise value (GMV) is easy to grow; sustainable margins are not. Understanding CAC, LTV, contribution margin, and payback period at the order and customer level is what separates brands that scale profitably from those that run out of runway.
This page defines each metric, shows how they connect, and explains how FireAI helps D2C brands calculate unit economics automatically from Shopify and marketplace data — no spreadsheets required.
Why Unit Economics Matter More Than Revenue
A D2C brand doing ₹5 Cr/month in revenue is not necessarily healthy. The questions that matter are:
- Does each new customer contribute positive margin after acquisition cost?
- How long does it take to recover the cost of acquiring each customer?
- Are repeat customers significantly more profitable than first-time buyers?
- Is contribution margin per order improving or eroding as you scale?
Revenue answers none of these. Unit economics answers all of them. For D2C finance teams, see D2C e-commerce finance use cases for how these metrics flow into operational financial planning.
The Four Core Unit Economics Metrics
1. Customer Acquisition Cost (CAC)
CAC is the total sales and marketing spend required to acquire one paying customer.
Formula:
CAC = Total Sales & Marketing Spend ÷ Number of New Customers Acquired
What counts in the numerator:
- Paid media (Meta Ads, Google Ads, influencer fees)
- Agency and creative fees
- Discount and coupon costs attributed to first purchase
- Sales team cost (if applicable)
- Attribution tools and platform fees
What is commonly miscounted:
- Brand spend is often excluded because it drives awareness, not direct acquisition — but if you cannot separate brand from performance spend cleanly, blend it all in
- Organic and referral customers lower your blended CAC, but your paid CAC may still be unsustainable
Benchmarks for Indian D2C:
- Personal care / beauty: ₹300–₹700 blended CAC is healthy; ₹1,200+ signals ad dependency
- Fashion / apparel: ₹400–₹900 depending on average order value (AOV)
- Food / grocery: ₹150–₹350 because of higher repeat purchase frequency
FireAI CAC calculation: FireAI connects to Meta Ads and Google Ads alongside your Shopify order data. It matches spend to new customer acquisition automatically — segmented by channel, campaign, and cohort — so you see paid CAC, organic CAC, and blended CAC as live dashboard metrics rather than a monthly spreadsheet exercise.
2. Customer Lifetime Value (LTV)
LTV is the total gross margin contribution a customer is expected to generate over their entire relationship with your brand.
Most D2C teams use a simplified LTV formula:
LTV = AOV × Purchase Frequency × Gross Margin % × Average Customer Lifespan
Or, for a more rigorous cohort-based calculation:
LTV = Σ (Gross Margin per Order × Probability of Repeat Purchase at each subsequent order)
The difference between revenue LTV and margin LTV matters enormously. A customer buying ₹3,000 worth of apparel at 40% gross margin contributes ₹1,200 in margin LTV per order — not ₹3,000. Many D2C brands overstate LTV by using revenue figures instead of margin.
Inputs required for accurate LTV:
- Historical order data by customer (Shopify or marketplace export)
- COGS by SKU or product category
- Returns and cancellation rates by cohort
- Gross margin after returns and fulfilment
12-month vs lifetime LTV: For most Indian D2C brands with 1–3 year operating history, 12-month LTV (LTV₁₂) is a more reliable metric than a lifetime projection, because churn modelling requires longer data windows. FireAI surfaces both, with the caveat clearly labelled.
FireAI LTV calculation: FireAI builds customer cohort LTV curves automatically from Shopify transaction history. You see LTV by acquisition channel, acquisition month, and product category — so you can identify which channels bring high-LTV customers vs high-volume, low-value customers. This changes ad budget allocation decisions significantly.
3. LTV:CAC Ratio
LTV:CAC is the single most important unit economics ratio for D2C brands. It tells you how much value you extract from a customer relative to what you spent to acquire them.
LTV:CAC Ratio = LTV ÷ CAC
Benchmarks:
- Below 1x: You are destroying value — the customer will never return what you spent acquiring them
- 1x–2x: Marginal — break-even or slightly above; no room for error
- 3x: The standard healthy benchmark for D2C; covers OPEX headroom
- 5x+: Strong — either CAC is very low (organic/referral-heavy) or repeat purchase is very high
The ratio is only half the story. A 4x LTV:CAC means nothing if LTV is recovered over 5 years while CAC was paid today. That is why payback period is equally important.
4. Payback Period
Payback period is the number of months required to recover the CAC from a customer's contribution margin.
Payback Period (months) = CAC ÷ (Monthly Contribution Margin per Customer)
Why it matters more than LTV:CAC for capital planning:
A business with a 4x LTV:CAC and 36-month payback has to fund 36 months of customer cohorts before seeing returns. In a high-growth phase, that creates an enormous working capital gap — which is why many fast-growing D2C brands are profitable on paper but cash-constrained in reality.
Benchmarks:
- Under 6 months: Excellent — fast capital recycling, low funding risk
- 6–12 months: Healthy for most D2C categories
- 12–18 months: Manageable but requires strong retention to justify
- 18+ months: High risk — requires significant external funding to sustain growth
FireAI payback tracking: FireAI calculates payback period by cohort, updated monthly as new orders arrive. If a January cohort's average payback was 8 months but a March cohort is trending to 14 months, that is an early warning signal visible in the dashboard before the full quarter ends.
5. Contribution Margin (Order-Level P&L)
Contribution margin is the profit remaining from a single order after all variable costs are deducted. It is the building block of unit economics — you cannot calculate LTV meaningfully without knowing contribution margin per order.
Order-level P&L structure:
Revenue (net of returns and cancellations)
– Product COGS
= Gross Margin

– Fulfilment / logistics cost
– Payment gateway fees (typically 1.5–2.5%)
– Marketplace commission (if applicable — 10–25% on Amazon/Flipkart)
– Customer support cost (allocated)
= Contribution Margin (Contribution Profit)

Contribution Margin % = Contribution Margin ÷ Net Revenue × 100
Typical D2C contribution margins:
- DTC website orders (no marketplace fee): 30–50%
- Marketplace orders (Amazon/Flipkart): 15–28%
- Quick commerce (Blinkit/Zepto): 8–18% due to high platform and dark store fees
The channel mix problem: A brand growing quickly on marketplaces may show improving GMV but declining average contribution margin — because marketplace orders are structurally less profitable. FireAI surfaces contribution margin by channel automatically so this mix shift is visible before it shows up in the monthly P&L.
How the Metrics Connect: The Unit Economics Flywheel
The four metrics are not independent — they form a system:
Contribution Margin → drives LTV
LTV ÷ CAC → LTV:CAC ratio (business model health)
CAC ÷ Monthly Contribution Margin → Payback Period (cash efficiency)
A D2C brand trying to improve unit economics has three levers:
- Lower CAC — improve organic mix, optimise paid channels, build referral loops
- Raise LTV — improve retention, increase AOV, reduce returns
- Improve contribution margin per order — reduce logistics cost, shift mix toward DTC channel, negotiate better COGS
FireAI shows all three levers as live metrics and flags when any of them deteriorates cohort-over-cohort — giving the team a specific number to act on rather than a vague sense that "margins are tightening."
How FireAI Calculates Unit Economics from Shopify and Marketplace Data
Most D2C brands track unit economics in Excel. The process looks like this: export Shopify orders, pull Meta Ads spend, download logistics invoices, and spend 3 days building a model. The result is usually 3 weeks stale by the time decisions get made.
FireAI replaces this entirely:
Data sources connected:
- Shopify (orders, returns, customer history, product COGS if entered)
- Meta Ads and Google Ads (spend by campaign, segmented to acquisition vs retargeting)
- Amazon Seller Central / Flipkart Seller Hub (orders, commissions, returns)
- Shiprocket or Delhivery (per-order logistics cost)
What FireAI calculates automatically:
- Blended CAC and paid CAC by channel and acquisition cohort
- LTV₃, LTV₆, LTV₁₂ curves by cohort, channel, and product category
- LTV:CAC ratio at brand level and broken down by channel
- Payback period by cohort, tracked monthly as orders come in
- Order-level contribution margin with marketplace commission and logistics costs deducted automatically
- Channel P&L — DTC vs Amazon vs Flipkart vs quick commerce, side by side
Natural language queries: Ask FireAI "What is my CAC on Meta Ads for customers acquired in Q1 who bought from the skincare range?" and get a precise number — not a pivot table exercise. This is especially useful for brand managers who need unit economics answers without waiting for a finance team report.
Anomaly alerts: FireAI flags when payback period for new cohorts is trending 20%+ longer than historical average — a leading indicator that CAC efficiency is declining before it shows up in quarterly numbers.
For a broader view of how these metrics connect to D2C financial planning, see D2C e-commerce finance use cases.
Common Unit Economics Mistakes in D2C
1. Using revenue LTV instead of margin LTV. If your AOV is ₹1,500 and gross margin is 35%, your margin LTV per order is ₹525 — not ₹1,500. Calculating LTV:CAC on revenue inflates the ratio by 3x and leads to overspending on acquisition.
2. Excluding returns from contribution margin. D2C return rates of 15–30% are common in fashion. A ₹2,000 order with a 25% return rate has an effective net revenue of ₹1,500 — which changes contribution margin and LTV significantly.
3. Blending all customer types. First-time buyers and repeat buyers have fundamentally different contribution profiles. If you average them together, your unit economics looks healthier than it is for new acquisition.
4. Ignoring channel mix in payback calculations. A brand with 60% Flipkart orders may show a 10-month payback period overall, but its DTC-only payback might be 5 months. That distinction tells you where to invest more.
5. Not updating cohort curves monthly. Unit economics is a dynamic metric, not an annual number. A cohort that looked like it would hit 3x LTV:CAC at month 3 may churn heavily by month 6 — only live cohort tracking catches this in time to act.
Ready to act on your data?
See how teams use FireAI to ask in plain language and get analytics they can trust.
Explore FireAI workflows
Go from this topic into product features and solution paths that match what you read here.
Topic hub
BI Fundamentals
Foundational guides on business intelligence, analytics architecture, self-service BI, and core data concepts.
Explore hubFrequently asked questions
Related in this topic
D2C Unit Economics: The Exact Formulas for CAC, LTV & Payback Period
Most D2C brands calculate CAC wrong and overestimate LTV. Get the exact formulas for channel-level CAC, cohort LTV, payback period, and contribution margin—with a step-by-step breakdown and automation tips.
What is a Financial Dashboard? Metrics and Examples
A financial dashboard displays key financial metrics — revenue, margin, cash flow, and expenses — in real time on a single screen. Learn what to include in a financial dashboard and how to build one from Tally or your accounting system.
D2C Analytics India: What Top Brands Actually Track
D2C brand analytics in India covers customer acquisition, retention cohorts, unit economics, and marketing attribution. Learn key dashboards for Indian D2C businesses.
What is a Marketing Analytics Dashboard?
A marketing analytics dashboard consolidates campaign performance, channel attribution, lead generation, and CAC metrics in one view. Learn what to include in a marketing dashboard and how to measure marketing ROI effectively.
From the blog
Data-Driven Customer Success: How Real-Time Metrics Reduce Churn
Discover how data-driven customer success teams use real-time metrics, causal analytics, and tools like FireAI to predict churn before it happens and turn insights into retention.

Measuring Promotion Effectiveness: A Data-Driven Guide for FMCG Marketers
FMCG brands in India spend 15–25% of gross revenue on trade promotions and A&SP (advertising and sales promotion) every year. Most can tell you how much they spent. Very few can tell you what it returned. The problem isn't a lack of data — it's that the data lives in disconnected places. Trade spend sits in finance. Off-take data lives with the distributor or field team. A&SP budgets are tracked in a marketing spreadsheet. No single view ties promotional investment to consumer pull at the outlet level. The result is a budget cycle where last year's spend allocation becomes next year's default, because no one has the numbers to argue for something different. This guide walks through how FMCG marketing and trade teams can build a promotion effectiveness framework that actually connects spend to outcome — not just channel-level assumptions.

Top 7 Marketing Metrics to Track in 2026 and How AI Simplifies Them
In 2026, track these 7 critical marketing metrics — CLV, CAC, ROAS, Conversion Rate, Engagement, Brand Awareness, and ROI — to prove real business impact instead of vanity stats.