


Key takeaways
Track fewer KPIs, not more. Six to ten metrics with targets and owners beat a 40-widget wall. Gartner found that 84% of sales leaders say analytics influenced performance less than expected, and the top reason was poor data quality, not too few charts.
If you sell through distributors, track secondary sales, not just primary. Primary billing tells you what left your warehouse. Secondary sales tell you what actually sold.
Put collections on the sales dashboard. Indian SMEs wait 73 days on average to get paid against a 45-day norm. A sale is not done until the money is in.
Connect to the source system. A dashboard fed by a weekly Excel export is a report, not a dashboard.
Add the why. Most tools show that revenue fell. Causal analysis tools such as FireAI show which region, product, distributor or scheme caused it.
What is a sales dashboard?
A sales dashboard is a live visual summary of sales performance. It pulls data from the systems where sales are recorded (Tally or an ERP for invoices, a CRM for pipeline, a distributor management system for secondary sales, a POS for retail) and shows a handful of KPIs against targets, with drill-downs by time, geography, product, customer and salesperson.
It differs from a sales report in three ways. It updates on its own. It is built for a decision, not for a meeting. And it is interactive, so the person looking at it can ask the next question without going back to the analyst.
The 10 sales KPIs that matter
Every business will add a few of its own, but these ten cover what most Indian founders, sales heads and CFOs ask for first. The formulas are the standard ones; sources are listed at the end.
| KPI | Formula | What it tells you | Watch out for |
|---|---|---|---|
| Revenue vs target | Actual revenue ÷ target × 100 | Whether you are on plan | Use net of GST and returns, or the number flatters you |
| Sales growth | (This period − last period) ÷ last period × 100 | Momentum | Compare like for like: same month last year beats last month in seasonal businesses |
| Pipeline coverage | Open pipeline value ÷ remaining target | Whether there is enough in play to hit the number | Many teams use 3x as a working rule; adjust for your win rate |
| Win rate | Deals won ÷ (deals won + deals lost) × 100 | Sales effectiveness | Exclude open deals from the denominator |
| Average deal size | Total value of closed deals ÷ number of closed deals | Deal quality and discounting | A falling average often means a discounting problem, not a demand problem |
| Sales cycle length | Total days closed deals were open ÷ number of closed deals | Speed of selling | Track by segment; enterprise and SME cycles should not be averaged together |
| Quota attainment | Closed sales ÷ quota × 100, per rep or territory | Who is on plan | Attainment spread matters as much as the average |
| Secondary sales / sell-through | Units sold by distributors ÷ (opening stock + units received) × 100 | What actually sold through the channel | A primary-secondary gap means stock piling up with distributors |
| Days sales outstanding (DSO) | Accounts receivable ÷ (annual credit sales ÷ 365) | How long you wait to get paid | Report by customer and by rep; collections are a sales KPI |
| Churn or customer retention | Customers lost ÷ customers at start of period × 100 | Whether growth is leaking | For distributor businesses, track inactive outlets instead |
Why secondary sales and DSO belong on the dashboard
Most sales KPI guides are written for US software companies and stop at pipeline and win rate. Indian businesses that sell through channels need two more numbers.
The first is secondary sales. In FMCG, pharma, electricals, agri-inputs and auto parts, the company bills a distributor or C&F agent (primary sales) and the distributor bills retailers (secondary sales). A strong primary month can hide a weak secondary month: the stock simply moved from your godown to the distributor's. When that gap persists, it comes back as returns, expiry claims or a collapsed next quarter.
The second is DSO. The Recordent Indian SME Receivables Report 2026, which covered about 1.1 lakh MSMEs, found invoices are paid in 73 days on average against a 45-day norm. If the sales team is paid on billing and nobody watches collections, the dashboard is rewarding the wrong behaviour.
Sales dashboard templates by role
One dashboard cannot serve everyone. These four layouts cover most Indian sales organisations. Each lists the KPIs at the top and the drill-downs below them.
1. Founder or CEO sales dashboard
Top row: Revenue vs target (month, quarter, year to date), sales growth vs same period last year, gross margin, DSO. Below: Revenue by region and by product category, top 10 customers with change vs last period, pipeline coverage for next quarter. One question it must answer: "Are we going to hit the quarter, and if not, where is the gap?"
2. Sales head dashboard
Top row: Quota attainment by region and by rep, win rate, average deal size, sales cycle length. Below: Pipeline by stage, deals slipping past their expected close date, discount depth by rep, new accounts opened. One question: "Which territory or rep needs attention this week?"
3. Distributor and channel sales dashboard (FMCG, pharma, consumer durables)
Top row: Primary sales, secondary sales, primary-secondary gap, distributor stock days. Below: Secondary sales by distributor and by SKU, scheme uptake, outlet coverage (billed outlets ÷ universe), productive calls per rep per day, returns and expiry claims. One question: "Is stock actually selling through, or just moving into the channel?"
4. Retail and multi-outlet dashboard
Top row: Sales per store, same-store growth, average bill value, items per bill. Below: Hourly and daily sales pattern, category mix, stock-outs on top sellers, promotion lift. One question: "Which stores and categories are under-performing and why?"
How to build a sales dashboard in 5 steps
- Start from the decision. Write down who looks at the dashboard, when, and what they will do differently. A dashboard nobody acts on is decoration.
- Choose 6 to 10 KPIs. Pick from the table above. Give each a target, an owner and a refresh frequency.
- Connect the source systems, do not export them. Invoices live in Tally or your ERP, pipeline in the CRM, secondary sales in the DMS. Tools with native connectors read these directly; tools without them depend on someone uploading a sheet every Monday.
- Set targets and alerts. A KPI without a target is a number. Alerts should go to the owner on email or WhatsApp when a threshold is crossed, so nobody has to remember to look.
- Add the why. Make sure every KPI can be broken down by region, product, customer and rep. Better still, use a tool that does the decomposition for you and ranks the drivers.
Sales dashboard tools compared for India
Prices are vendor list prices in November 2026 and exclude GST. Check the vendor's page before buying.
| Tool | Best for | Starting price | Native Tally connector | Explains why a KPI moved |
|---|---|---|---|---|
| FireAI | Indian SMEs and mid-size companies on Tally, ERP, DMS or POS without a data team | Free plan; Professional ₹3,499/month | Yes | Yes, Causal Chain ranks the drivers |
| Microsoft Power BI | Companies on Microsoft 365 with an analyst | Pro about ₹1,165/user/month (annual) | No, via third-party connectors | Partial (key influencers visual) |
| Zoho Analytics | Zoho CRM and Zoho Books users, small teams | From about ₹960/month (Basic, annual, partner-reported) | Via import | Limited |
| Salesforce Sales Cloud reports | Teams already running Salesforce | Starter Suite $25/user/month | No | No |
| HubSpot Sales Hub | Inbound-led SMEs | Starter $9/seat/month (annual) | No | No |
| Excel or Google Sheets | One-person businesses | Free to ₹1,000s/month for Microsoft 365 | Manual export | No |
| Tableau | Analyst-heavy teams, visual depth | Creator $75/user/month (annual) | No | Partial |
FireAI is our own product, so a note on where the others are better: Power BI and Tableau are the stronger choice if you have an analyst and want full control over visual design. Salesforce and HubSpot reporting is the natural choice if your sales process lives entirely in that CRM and you do not need Tally or distributor data on the same screen.
Where most sales dashboards fall short: they stop at "what"
Every tool above can show you that revenue fell 9% last month. The work starts after that. Someone opens the invoice register, the distributor report and the CRM, and spends a day finding out that two distributors in Maharashtra under-ordered after a scheme change, and that a top SKU was out of stock for 11 days.
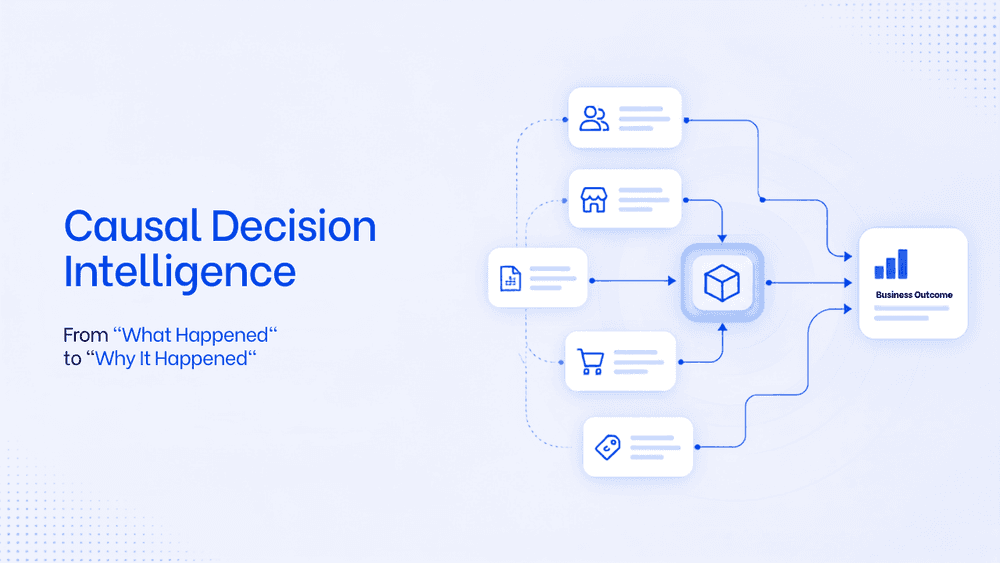
This is the gap causal decision intelligence closes. FireAI's Causal Chain traces a change in a KPI across linked dimensions (region, product, distributor, rep, scheme, stock) and ranks the drivers by contribution. Instead of "sales fell 9%", the dashboard says "sales fell 9%; 6 points came from Distributor A and B in the West region, 2 from the stock-out on SKU X". You can then ask a follow-up in plain English, in Hindi or in 90+ other languages, through Ask FireAI.
Two FireAI customers show what that looks like in practice. Daffoworth Pharmaceuticals consolidated scattered spreadsheets into six role-based dashboards in about two weeks and reported 10.76% quarter-on-quarter net sales growth and 22.6% lower sales-return losses. ISA Logistics cut manual reporting effort by 60 to 70% with a direct Tally integration. Both case studies are on the FireAI site.
Common mistakes
- Reporting gross billing. Net of GST, returns and credit notes, or the number is not comparable to the target.
- Averaging across segments. A single win rate for enterprise and SME deals hides both problems.
- Ignoring stock. For product businesses, stock-outs are a sales problem. Put top-SKU availability on the sales dashboard.
- Refreshing by hand. If the dashboard depends on a weekly upload, it will be out of date exactly when someone needs it.
- No owner per KPI. Every number on the screen should have a name next to it.
Start free with FireAI or book a demo to see a sales dashboard built on your own data.
Sources
- Gartner, Sales analytics has less influence on sales performance than leadership expected, February 2024
- Salesforce, State of Sales, sales AI statistics, 2024
- Recordent Indian SME Receivables Report 2026, as reported by MediaBrief, June 2026
- Gong, Sales performance metrics and formulas
- Databox, The ultimate guide to sales KPIs
- HubSpot, Customer acquisition cost
- Klipfolio, Sell-through rate
- Microsoft, Power BI pricing (India)
- HubSpot, Sales Hub pricing; Salesforce, small business pricing (India)
- Tally Solutions, Getting started with Tally integrations
FireAI, pricing and case studies